

6 Methods for Functional Connectivity Analysis
141
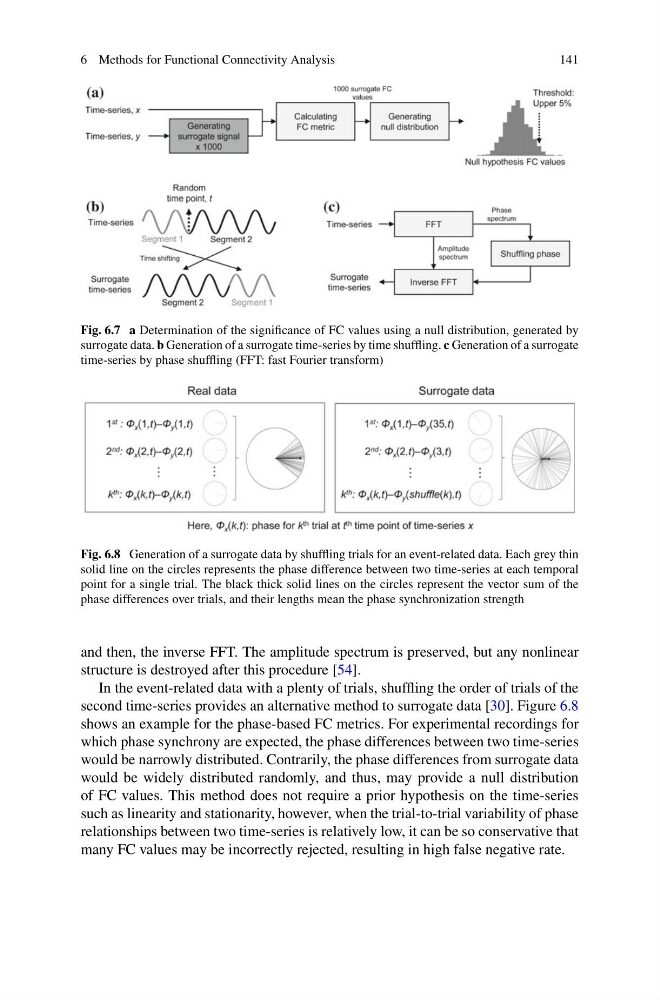
Fig. 6.7 a Determination of the significance of FC values using a null distribution, generated by
surrogate data. b Generation of a surrogate time-series by time shuffling. c Generation of a surrogate
time-series by phase shuffling (FFT: fast Fourier transform)
Fig. 6.8 Generation of a surrogate data by shuffling trials for an event-related data. Each grey thin
solid line on the circles represents the phase difference between two time-series at each temporal
point for a single trial. The black thick solid lines on the circles represent the vector sum of the
phase differences over trials, and their lengths mean the phase synchronization strength
and then, the inverse FFT. The amplitude spectrum is preserved, but any nonlinear
structure is destroyed after this procedure [54].
In the event-related data with a plenty of trials, shuffling the order of trials of the
second time-series provides an alternative method to surrogate data [30]. Figure 6.8
shows an example for the phase-based FC metrics. For experimental recordings for
which phase synchrony are expected, the phase differences between two time-series
would be narrowly distributed. Contrarily, the phase differences from surrogate data
would be widely distributed randomly, and thus, may provide a null distribution
of FC values. This method does not require a prior hypothesis on the time-series
such as linearity and stationarity, however, when the trial-to-trial variability of phase
relationships between two time-series is relatively low, it can be so conservative that
many FC values may be incorrectly rejected, resulting in high false negative rate.
141
Fig. 6.7 a Determination of the significance of FC values using a null distribution, generated by
surrogate data. b Generation of a surrogate time-series by time shuffling. c Generation of a surrogate
time-series by phase shuffling (FFT: fast Fourier transform)
Fig. 6.8 Generation of a surrogate data by shuffling trials for an event-related data. Each grey thin
solid line on the circles represents the phase difference between two time-series at each temporal
point for a single trial. The black thick solid lines on the circles represent the vector sum of the
phase differences over trials, and their lengths mean the phase synchronization strength
and then, the inverse FFT. The amplitude spectrum is preserved, but any nonlinear
structure is destroyed after this procedure [54].
In the event-related data with a plenty of trials, shuffling the order of trials of the
second time-series provides an alternative method to surrogate data [30]. Figure 6.8
shows an example for the phase-based FC metrics. For experimental recordings for
which phase synchrony are expected, the phase differences between two time-series
would be narrowly distributed. Contrarily, the phase differences from surrogate data
would be widely distributed randomly, and thus, may provide a null distribution
of FC values. This method does not require a prior hypothesis on the time-series
such as linearity and stationarity, however, when the trial-to-trial variability of phase
relationships between two time-series is relatively low, it can be so conservative that
many FC values may be incorrectly rejected, resulting in high false negative rate.