

116
Y. Zhang
stellate cells [43]. This method proved to be effective at reproducing a variety of
oscillating and spiking patterns that closely resembled experimental data. The model
has since been expanded to cover a single or multiple cortical areas with the added
context of hemodynamic coupling [4, 5]. While these models have shown a remarkable amount detail, it will be easier to illustrate the overall process of neurogenerative
modelling using simpler approaches, such as that presented by Buxton et al. in 2004
[14], which modeled the total neural activity as the difference between excitatory
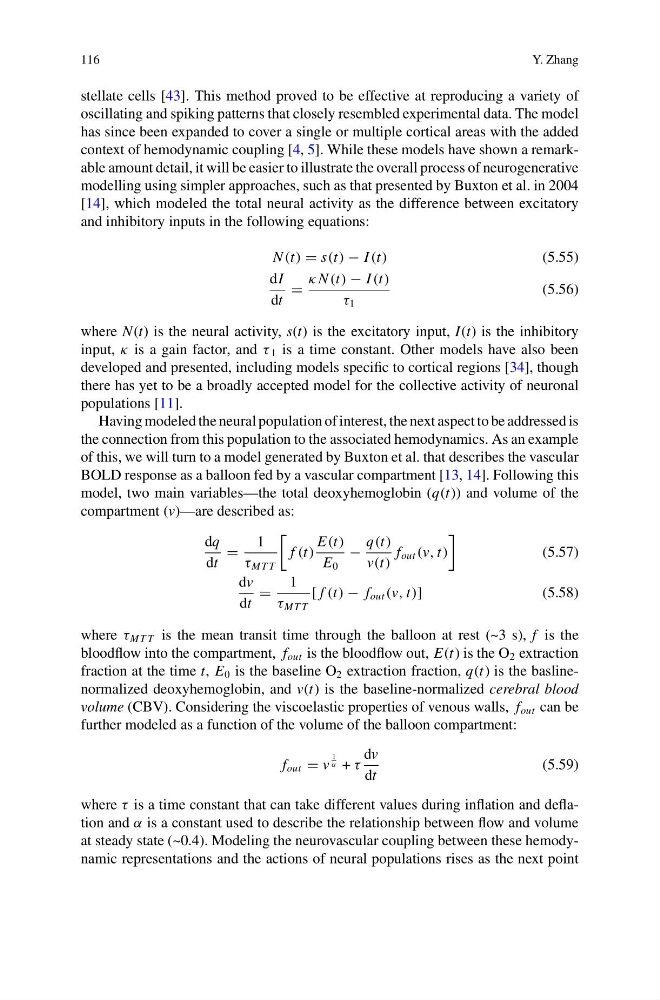
and inhibitory inputs in the following equations:
N (t) s(t) − I (t)
(5.55)
dI
dt
κ N (t) − I (t)
τ 1
(5.56)
where N(t) is the neural activity, s(t) is the excitatory input, I(t) is the inhibitory
input, κ is a gain factor, and τ 1 is a time constant. Other models have also been
developed and presented, including models specific to cortical regions [34], though
there has yet to be a broadly accepted model for the collective activity of neuronal
populations [11].
Having modeled the neural population of interest, the next aspect to be addressed is
the connection from this population to the associated hemodynamics. As an example
of this, we will turn to a model generated by Buxton et al. that describes the vascular
BOLD response as a balloon fed by a vascular compartment [13, 14]. Following this
model, two main variables—the total deoxyhemoglobin (q(t)) and volume of the
compartment (v)—are described as:
dq
dt
1
τ MT T
f (t)
E(t)
E 0
−
q(t)
v(t)
f out (v, t)
(5.57)
dv
dt
1
τ MT T
[ f (t) − f out (v, t)]
(5.58)
where τ MT T is the mean transit time through the balloon at rest (~3 s), f is the
bloodflow into the compartment, f out is the bloodflow out, E(t) is the O 2 extraction
fraction at the time t, E 0 is the baseline O 2 extraction fraction, q(t) is the baslinenormalized deoxyhemoglobin, and v(t) is the baseline-normalized cerebral blood
volume (CBV). Considering the viscoelastic properties of venous walls, f out can be
further modeled as a function of the volume of the balloon compartment:
f out v
1
α + τ
dv
dt
(5.59)
where τ is a time constant that can take different values during inflation and deflation and α is a constant used to describe the relationship between flow and volume
at steady state (~0.4). Modeling the neurovascular coupling between these hemodynamic representations and the actions of neural populations rises as the next point
Y. Zhang
stellate cells [43]. This method proved to be effective at reproducing a variety of
oscillating and spiking patterns that closely resembled experimental data. The model
has since been expanded to cover a single or multiple cortical areas with the added
context of hemodynamic coupling [4, 5]. While these models have shown a remarkable amount detail, it will be easier to illustrate the overall process of neurogenerative
modelling using simpler approaches, such as that presented by Buxton et al. in 2004
[14], which modeled the total neural activity as the difference between excitatory
and inhibitory inputs in the following equations:
N (t) s(t) − I (t)
(5.55)
dI
dt
κ N (t) − I (t)
τ 1
(5.56)
where N(t) is the neural activity, s(t) is the excitatory input, I(t) is the inhibitory
input, κ is a gain factor, and τ 1 is a time constant. Other models have also been
developed and presented, including models specific to cortical regions [34], though
there has yet to be a broadly accepted model for the collective activity of neuronal
populations [11].
Having modeled the neural population of interest, the next aspect to be addressed is
the connection from this population to the associated hemodynamics. As an example
of this, we will turn to a model generated by Buxton et al. that describes the vascular
BOLD response as a balloon fed by a vascular compartment [13, 14]. Following this
model, two main variables—the total deoxyhemoglobin (q(t)) and volume of the
compartment (v)—are described as:
dq
dt
1
τ MT T
f (t)
E(t)
E 0
−
q(t)
v(t)
f out (v, t)
(5.57)
dv
dt
1
τ MT T
[ f (t) − f out (v, t)]
(5.58)
where τ MT T is the mean transit time through the balloon at rest (~3 s), f is the
bloodflow into the compartment, f out is the bloodflow out, E(t) is the O 2 extraction
fraction at the time t, E 0 is the baseline O 2 extraction fraction, q(t) is the baslinenormalized deoxyhemoglobin, and v(t) is the baseline-normalized cerebral blood
volume (CBV). Considering the viscoelastic properties of venous walls, f out can be
further modeled as a function of the volume of the balloon compartment:
f out v
1
α + τ
dv
dt
(5.59)
where τ is a time constant that can take different values during inflation and deflation and α is a constant used to describe the relationship between flow and volume
at steady state (~0.4). Modeling the neurovascular coupling between these hemodynamic representations and the actions of neural populations rises as the next point