

96
Y. Zhang
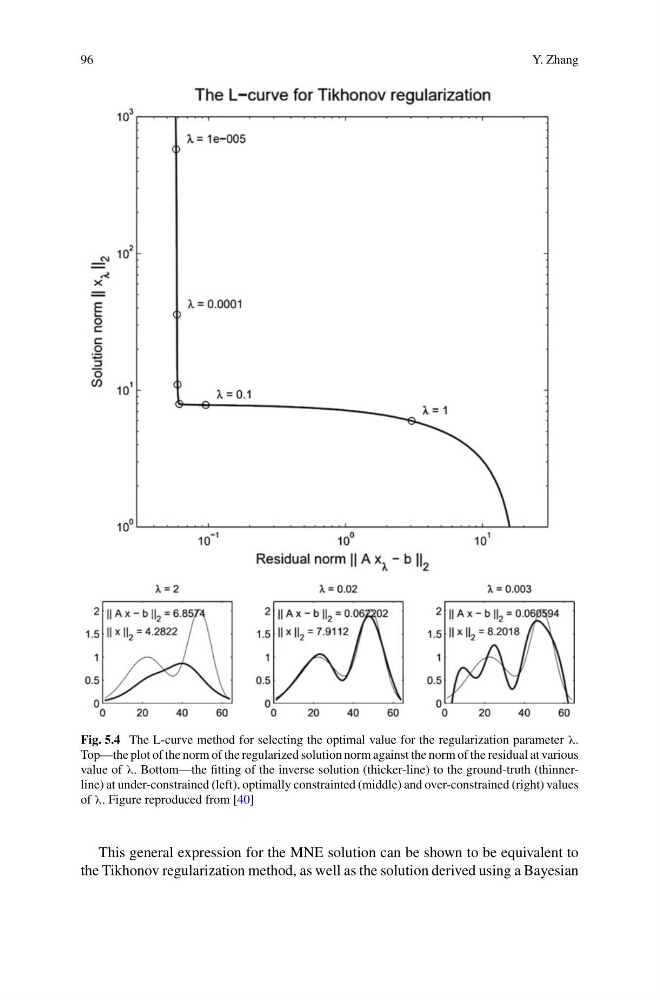
Fig. 5.4 The L-curve method for selecting the optimal value for the regularization parameter λ.
Top—the plot of the norm of the regularized solution norm against the norm of the residual at various
value of λ. Bottom—the fitting of the inverse solution (thicker-line) to the ground-truth (thinnerline) at under-constrained (left), optimally constrainted (middle) and over-constrained (right) values
of λ. Figure reproduced from [40]
This general expression for the MNE solution can be shown to be equivalent to
the Tikhonov regularization method, as well as the solution derived using a Bayesian
Y. Zhang
Fig. 5.4 The L-curve method for selecting the optimal value for the regularization parameter λ.
Top—the plot of the norm of the regularized solution norm against the norm of the residual at various
value of λ. Bottom—the fitting of the inverse solution (thicker-line) to the ground-truth (thinnerline) at under-constrained (left), optimally constrainted (middle) and over-constrained (right) values
of λ. Figure reproduced from [40]
This general expression for the MNE solution can be shown to be equivalent to
the Tikhonov regularization method, as well as the solution derived using a Bayesian