

Evolution of the Total Content of COCs (tCOCs)
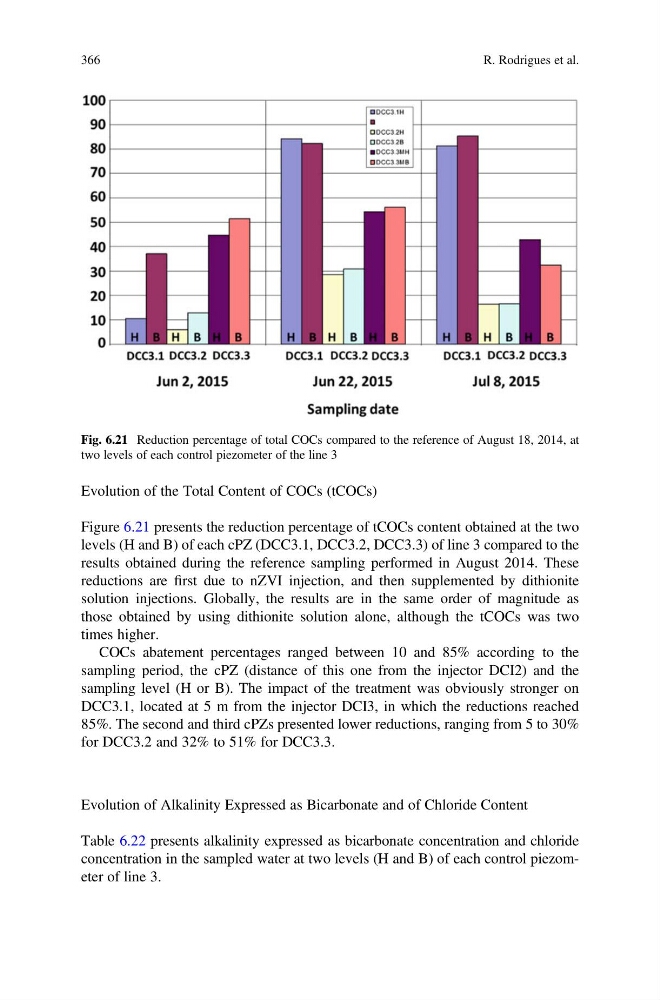
Figure 6.21 presents the reduction percentage of tCOCs content obtained at the two
levels (H and B) of each cPZ (DCC3.1, DCC3.2, DCC3.3) of line 3 compared to the
results obtained during the reference sampling performed in August 2014. These
reductions are first due to nZVI injection, and then supplemented by dithionite
solution injections. Globally, the results are in the same order of magnitude as
those obtained by using dithionite solution alone, although the tCOCs was two
times higher.
COCs abatement percentages ranged between 10 and 85% according to the
sampling period, the cPZ (distance of this one from the injector DCI2) and the
sampling level (H or B). The impact of the treatment was obviously stronger on
DCC3.1, located at 5 m from the injector DCI3, in which the reductions reached
85%. The second and third cPZs presented lower reductions, ranging from 5 to 30%
for DCC3.2 and 32% to 51% for DCC3.3.
Evolution of Alkalinity Expressed as Bicarbonate and of Chloride Content
Table 6.22 presents alkalinity expressed as bicarbonate concentration and chloride
concentration in the sampled water at two levels (H and B) of each control piezometer of line 3.
Fig. 6.21 Reduction percentage of total COCs compared to the reference of August 18, 2014, at
two levels of each control piezometer of the line 3
366
R. Rodrigues et al.
Figure 6.21 presents the reduction percentage of tCOCs content obtained at the two
levels (H and B) of each cPZ (DCC3.1, DCC3.2, DCC3.3) of line 3 compared to the
results obtained during the reference sampling performed in August 2014. These
reductions are first due to nZVI injection, and then supplemented by dithionite
solution injections. Globally, the results are in the same order of magnitude as
those obtained by using dithionite solution alone, although the tCOCs was two
times higher.
COCs abatement percentages ranged between 10 and 85% according to the
sampling period, the cPZ (distance of this one from the injector DCI2) and the
sampling level (H or B). The impact of the treatment was obviously stronger on
DCC3.1, located at 5 m from the injector DCI3, in which the reductions reached
85%. The second and third cPZs presented lower reductions, ranging from 5 to 30%
for DCC3.2 and 32% to 51% for DCC3.3.
Evolution of Alkalinity Expressed as Bicarbonate and of Chloride Content
Table 6.22 presents alkalinity expressed as bicarbonate concentration and chloride
concentration in the sampled water at two levels (H and B) of each control piezometer of line 3.
Fig. 6.21 Reduction percentage of total COCs compared to the reference of August 18, 2014, at
two levels of each control piezometer of the line 3
366
R. Rodrigues et al.