

• Level 2: March 20, 2015: injection of 1 canister of nZVI solution: water flowrate
of 237 L h
À1 and nZVI solution flowrate of 84 mL min
À1 ; i.e., continuously
21.2 mL of nZVI per liter of water
• Level 3: March 23, 2015: injection of 1 canister of nZVI solution: water flowrate
of 327 L h
À1 and nZVI solution flowrate of 84 mL min
À1 ; i.e., continuously
15.4 mL of nZVI per liter of water
• Level 4: March 24, 2015: injection of 1 canister nZVI solution by using a
suppressor
The injection resulted in the occurrence of a vertical barrier limiting itself to
injector DCI2 and its immediate vicinity.
Evolution of the Total Content of COCs
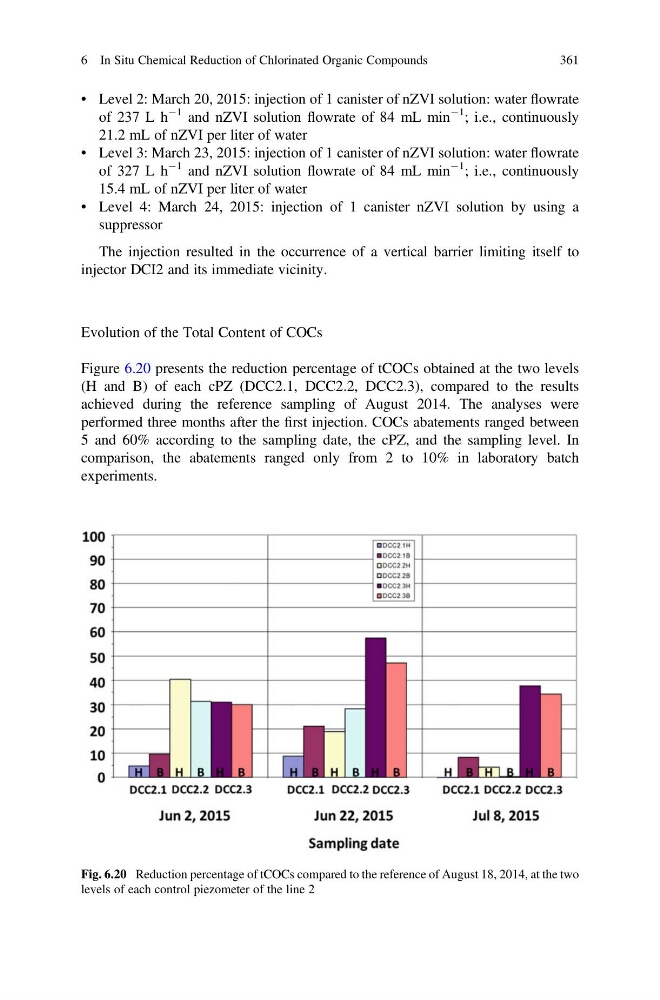
Figure 6.20 presents the reduction percentage of tCOCs obtained at the two levels
(H and B) of each cPZ (DCC2.1, DCC2.2, DCC2.3), compared to the results
achieved during the reference sampling of August 2014. The analyses were
performed three months after the first injection. COCs abatements ranged between
5 and 60% according to the sampling date, the cPZ, and the sampling level. In
comparison, the abatements ranged only from 2 to 10% in laboratory batch
experiments.
Fig. 6.20 Reduction percentage of tCOCs compared to the reference of August 18, 2014, at the two
levels of each control piezometer of the line 2
6 In Situ Chemical Reduction of Chlorinated Organic Compounds
361
of 237 L h
À1 and nZVI solution flowrate of 84 mL min
À1 ; i.e., continuously
21.2 mL of nZVI per liter of water
• Level 3: March 23, 2015: injection of 1 canister of nZVI solution: water flowrate
of 327 L h
À1 and nZVI solution flowrate of 84 mL min
À1 ; i.e., continuously
15.4 mL of nZVI per liter of water
• Level 4: March 24, 2015: injection of 1 canister nZVI solution by using a
suppressor
The injection resulted in the occurrence of a vertical barrier limiting itself to
injector DCI2 and its immediate vicinity.
Evolution of the Total Content of COCs
Figure 6.20 presents the reduction percentage of tCOCs obtained at the two levels
(H and B) of each cPZ (DCC2.1, DCC2.2, DCC2.3), compared to the results
achieved during the reference sampling of August 2014. The analyses were
performed three months after the first injection. COCs abatements ranged between
5 and 60% according to the sampling date, the cPZ, and the sampling level. In
comparison, the abatements ranged only from 2 to 10% in laboratory batch
experiments.
Fig. 6.20 Reduction percentage of tCOCs compared to the reference of August 18, 2014, at the two
levels of each control piezometer of the line 2
6 In Situ Chemical Reduction of Chlorinated Organic Compounds
361