

2001 to 500 μg L
À1 in 2013. TCE concentration was constant from 2002 to 2008,
and then increased from 2009. 1,1-DCE was the most concentrated breakdown
product, with an average concentration of 6000 μg L
À1 .
Figure 6.11 presents the COCs content evolution at piezometer PZ14 from 2005
to 2013. The natural attenuation of the plume in this direction was completely
achieved before 2008.
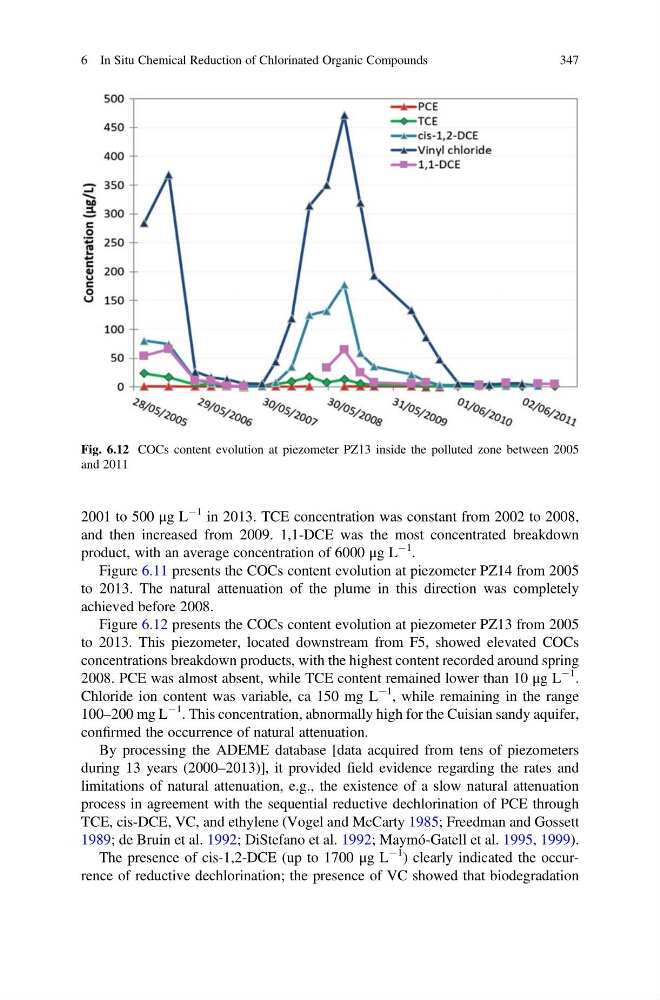
Figure 6.12 presents the COCs content evolution at piezometer PZ13 from 2005
to 2013. This piezometer, located downstream from F5, showed elevated COCs
concentrations breakdown products, with the highest content recorded around spring
2008. PCE was almost absent, while TCE content remained lower than 10 μg L
À1 .
Chloride ion content was variable, ca 150 mg L
À1 , while remaining in the range
100–200 mg L
À1 . This concentration, abnormally high for the Cuisian sandy aquifer,
confirmed the occurrence of natural attenuation.
By processing the ADEME database [data acquired from tens of piezometers
during 13 years (2000–2013)], it provided field evidence regarding the rates and
limitations of natural attenuation, e.g., the existence of a slow natural attenuation
process in agreement with the sequential reductive dechlorination of PCE through
TCE, cis-DCE, VC, and ethylene (Vogel and McCarty 1985; Freedman and Gossett
1989; de Bruin et al. 1992; DiStefano et al. 1992; Maymó-Gatell et al. 1995, 1999).
The presence of cis-1,2-DCE (up to 1700 μg L
À1 ) clearly indicated the occurrence of reductive dechlorination; the presence of VC showed that biodegradation
Fig. 6.12 COCs content evolution at piezometer PZ13 inside the polluted zone between 2005
and 2011
6 In Situ Chemical Reduction of Chlorinated Organic Compounds
347
À1 in 2013. TCE concentration was constant from 2002 to 2008,
and then increased from 2009. 1,1-DCE was the most concentrated breakdown
product, with an average concentration of 6000 μg L
À1 .
Figure 6.11 presents the COCs content evolution at piezometer PZ14 from 2005
to 2013. The natural attenuation of the plume in this direction was completely
achieved before 2008.
Figure 6.12 presents the COCs content evolution at piezometer PZ13 from 2005
to 2013. This piezometer, located downstream from F5, showed elevated COCs
concentrations breakdown products, with the highest content recorded around spring
2008. PCE was almost absent, while TCE content remained lower than 10 μg L
À1 .
Chloride ion content was variable, ca 150 mg L
À1 , while remaining in the range
100–200 mg L
À1 . This concentration, abnormally high for the Cuisian sandy aquifer,
confirmed the occurrence of natural attenuation.
By processing the ADEME database [data acquired from tens of piezometers
during 13 years (2000–2013)], it provided field evidence regarding the rates and
limitations of natural attenuation, e.g., the existence of a slow natural attenuation
process in agreement with the sequential reductive dechlorination of PCE through
TCE, cis-DCE, VC, and ethylene (Vogel and McCarty 1985; Freedman and Gossett
1989; de Bruin et al. 1992; DiStefano et al. 1992; Maymó-Gatell et al. 1995, 1999).
The presence of cis-1,2-DCE (up to 1700 μg L
À1 ) clearly indicated the occurrence of reductive dechlorination; the presence of VC showed that biodegradation
Fig. 6.12 COCs content evolution at piezometer PZ13 inside the polluted zone between 2005
and 2011
6 In Situ Chemical Reduction of Chlorinated Organic Compounds
347