

thousands of mg kg
À1 at relatively low costs, ranging from 20 to 220 € ton
À1 ,
depending on the technology implemented (Khan et al. 2004; BRGM 2010).
1.1.2 Why the Leaching Solutions Should Be Reused?
Water recirculation is commonly used in SW since every kg of soil treated requires
several liters of water (Zhang et al. 2001; Lee et al. 2005; Elgh-Dalgren et al. 2009).
The reuse of soil leachates should be considered as it is required to recover and treat
highly contaminated wastewater. It is stimulated in the current context of sustainable
development and economic optimization. Water reuse is highly encouraged for two
reasons: on the one hand, in order to reduce water withdrawals from the natural
environment and water stress on aquatic populations, and on the other hand, within a
strengthening regulatory context, to reduce the fluxes of contaminant discharged into
the natural environment (http://seee-cms-rec.eaufrance.fr/s-informer/). The zeroliquid discharge in receiving natural environment is now promoted (Qurie et al.
2015; Tong and Elimelech 2016). Besides, the reuse of chemical additives present in
soil leachates allows the impacts of the raw materials extraction to be reduced, since
the transport and transformation steps to supply these chemical agents may be
avoided (Sect. 1.4). In fact, there are minimal concentrations of active chemicals,
often substantial (e.g., critical micellar concentration (CMC) for surfactants when
used for contaminant solubilization) below which additives have no significant role,
and, actually, the reuse of these molecules helps to fill this gap. The use of more and
more sophisticated molecules subjected to restrictive specifications (e.g., biotoxicity,
biodegradability, and specific activity) justifies the economic interest of their reuse.
The cost of most of usual active agents is ranging from hundreds to thousands of
euros per ton. Mass balances about the transfer of chemicals between the top soil and
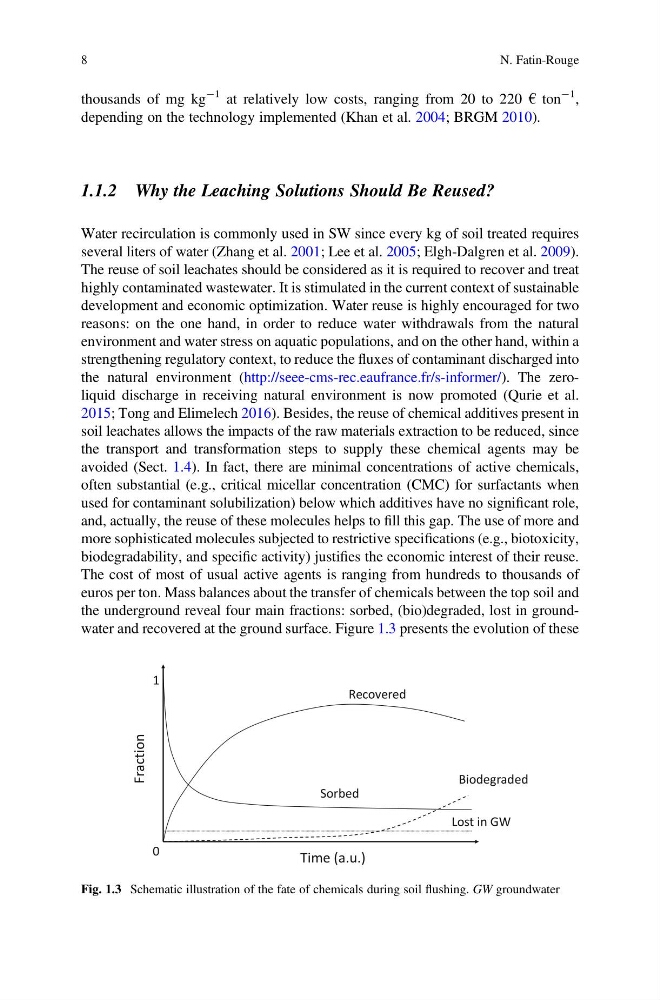
the underground reveal four main fractions: sorbed, (bio)degraded, lost in groundwater and recovered at the ground surface. Figure 1.3 presents the evolution of these
Time (a.u.)
Fraction
0
1
Lost in GW
Biodegraded
Recovered
Sorbed
Fig. 1.3 Schematic illustration of the fate of chemicals during soil flushing. GW groundwater
8
N. Fatin-Rouge
À1 at relatively low costs, ranging from 20 to 220 € ton
À1 ,
depending on the technology implemented (Khan et al. 2004; BRGM 2010).
1.1.2 Why the Leaching Solutions Should Be Reused?
Water recirculation is commonly used in SW since every kg of soil treated requires
several liters of water (Zhang et al. 2001; Lee et al. 2005; Elgh-Dalgren et al. 2009).
The reuse of soil leachates should be considered as it is required to recover and treat
highly contaminated wastewater. It is stimulated in the current context of sustainable
development and economic optimization. Water reuse is highly encouraged for two
reasons: on the one hand, in order to reduce water withdrawals from the natural
environment and water stress on aquatic populations, and on the other hand, within a
strengthening regulatory context, to reduce the fluxes of contaminant discharged into
the natural environment (http://seee-cms-rec.eaufrance.fr/s-informer/). The zeroliquid discharge in receiving natural environment is now promoted (Qurie et al.
2015; Tong and Elimelech 2016). Besides, the reuse of chemical additives present in
soil leachates allows the impacts of the raw materials extraction to be reduced, since
the transport and transformation steps to supply these chemical agents may be
avoided (Sect. 1.4). In fact, there are minimal concentrations of active chemicals,
often substantial (e.g., critical micellar concentration (CMC) for surfactants when
used for contaminant solubilization) below which additives have no significant role,
and, actually, the reuse of these molecules helps to fill this gap. The use of more and
more sophisticated molecules subjected to restrictive specifications (e.g., biotoxicity,
biodegradability, and specific activity) justifies the economic interest of their reuse.
The cost of most of usual active agents is ranging from hundreds to thousands of
euros per ton. Mass balances about the transfer of chemicals between the top soil and
the underground reveal four main fractions: sorbed, (bio)degraded, lost in groundwater and recovered at the ground surface. Figure 1.3 presents the evolution of these
Time (a.u.)
Fraction
0
1
Lost in GW
Biodegraded
Recovered
Sorbed
Fig. 1.3 Schematic illustration of the fate of chemicals during soil flushing. GW groundwater
8
N. Fatin-Rouge