

9.3 Results
9.3.1 Past Vegetation Changes and Its Drivers
9.3.1.1 Trends from the Last Glacial Maximum to the African Humid
Period
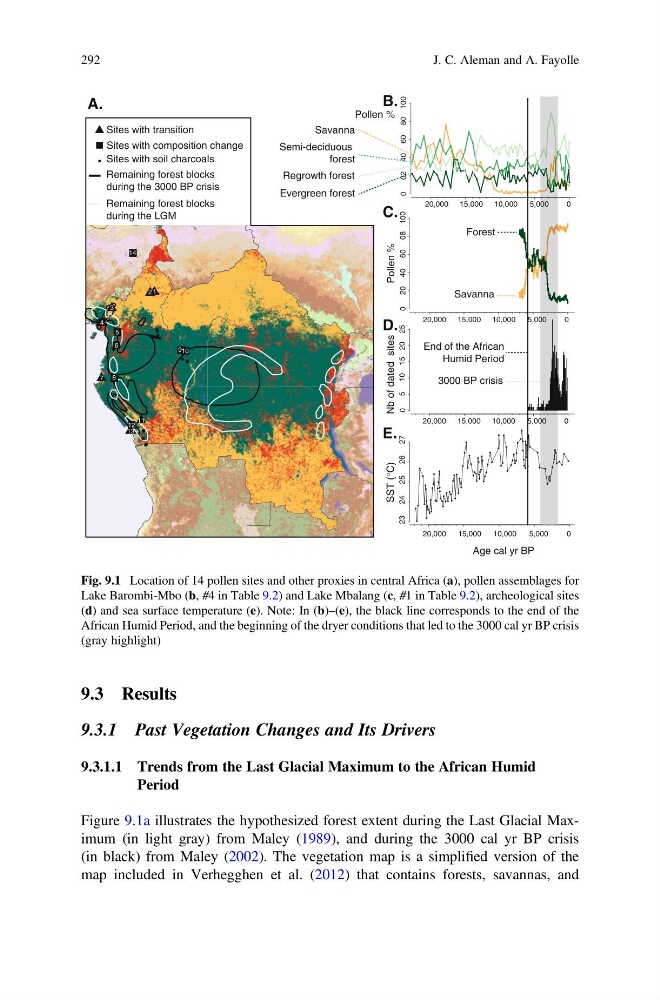
Figure 9.1a illustrates the hypothesized forest extent during the Last Glacial Maximum (in light gray) from Maley (1989), and during the 3000 cal yr BP crisis
(in black) from Maley (2002). The vegetation map is a simplified version of the
map included in Verhegghen et al. (2012) that contains forests, savannas, and
20,000
15,000
10,000
5,000
0
23
24
25
26
27
SST (°C)
20,000 15,000 10,000
5,000
0
0
02 40 60 80 100
Pollen %
20,000 15,000 10,000
5,000
0
0
20 40 60 08 100
Pollen %
Nb of dated sites
20,000 15,000 10,000
5,000
0
10 15 20 25
5
0
Savanna
Evergreen forest
Semi-deciduous
forest
Regrowth forest
Savanna
Forest
Polle
Savanna
Evergreen forest
Semi-deciduous
forest
Regrowth forest
1
3
910
2
4
5
6
8
7
11
12
13
00
00
00
0
0
0
0
0
0
Age cal yr BP
B.
C.
D.
E.
A.
14
End of the African
Humid Period
Sites with transition
Sites with composition change
Sites with soil charcoals
Remaining forest blocks
during the 3000 BP crisis
Remaining forest blocks
during the LGM
3000 BP crisis
Fig. 9.1 Location of 14 pollen sites and other proxies in central Africa (a), pollen assemblages for
Lake Barombi-Mbo (b, #4 in Table 9.2) and Lake Mbalang (c, #1 in Table 9.2), archeological sites
(d) and sea surface temperature (e). Note: In (b)–(e), the black line corresponds to the end of the
African Humid Period, and the beginning of the dryer conditions that led to the 3000 cal yr BP crisis
(gray highlight)
292
J. C. Aleman and A. Fayolle
9.3.1 Past Vegetation Changes and Its Drivers
9.3.1.1 Trends from the Last Glacial Maximum to the African Humid
Period
Figure 9.1a illustrates the hypothesized forest extent during the Last Glacial Maximum (in light gray) from Maley (1989), and during the 3000 cal yr BP crisis
(in black) from Maley (2002). The vegetation map is a simplified version of the
map included in Verhegghen et al. (2012) that contains forests, savannas, and
20,000
15,000
10,000
5,000
0
23
24
25
26
27
SST (°C)
20,000 15,000 10,000
5,000
0
0
02 40 60 80 100
Pollen %
20,000 15,000 10,000
5,000
0
0
20 40 60 08 100
Pollen %
Nb of dated sites
20,000 15,000 10,000
5,000
0
10 15 20 25
5
0
Savanna
Evergreen forest
Semi-deciduous
forest
Regrowth forest
Savanna
Forest
Polle
Savanna
Evergreen forest
Semi-deciduous
forest
Regrowth forest
1
3
910
2
4
5
6
8
7
11
12
13
00
00
00
0
0
0
0
0
0
Age cal yr BP
B.
C.
D.
E.
A.
14
End of the African
Humid Period
Sites with transition
Sites with composition change
Sites with soil charcoals
Remaining forest blocks
during the 3000 BP crisis
Remaining forest blocks
during the LGM
3000 BP crisis
Fig. 9.1 Location of 14 pollen sites and other proxies in central Africa (a), pollen assemblages for
Lake Barombi-Mbo (b, #4 in Table 9.2) and Lake Mbalang (c, #1 in Table 9.2), archeological sites
(d) and sea surface temperature (e). Note: In (b)–(e), the black line corresponds to the end of the
African Humid Period, and the beginning of the dryer conditions that led to the 3000 cal yr BP crisis
(gray highlight)
292
J. C. Aleman and A. Fayolle