

et al. (2013) and complemented by Morin-Rivat et al. (2014). The combined dataset
consists of 585
14 C-dated records from archaeological sites covering the period 5000
to 100 cal yr BP. Each record is calibrated using the IntCal13 curve and a probability
density is obtained through a Bayesian modeling procedure in the “Bchron” package
(R Core Team 2015). For each date, we used the median of the probability density,
and bin the number of dates every 50 years.
Finally, we illustrated climate change effects during this period, by reporting sea
surface temperature (SST) reconstructed from a core in the Guinea Gulf (Weldeab
et al. 2007).
9.2.2.2 Assessment of Current Vegetation Cover and Change
We used remotely sensed information about vegetation types (Verhegghen et al.
2012) at the regional scale with a pixel resolution of 900 m, to understand current
vegetation types and recent vegetation cover changes across the study region (i.e.,
between 2000 and 2015) (see Sect. 9.3.2). We aggregated the different vegetation
types into the following eight classes: (1) tropical forest; (2) montane forest;
(3) swamp forest; (4) mangrove; (5) savanna (containing the different savanna
types of the original map); (6) forest–savanna mosaic; (7) Miombo woodland; and
(8) areas impacted by humans. The areas affected by humans contain all such classes
from the original map, including agricultural areas, human settlements, and roads,
among others. To delineate the main biogeographic zones (i.e., phytochoria) in
central Africa, we used the biogeographic regions from White (1983) and Linder
et al. (2012).
Altitude and topography are important determinants of vegetation distribution
across the Tropics, including in central Africa. A very important distinction in the
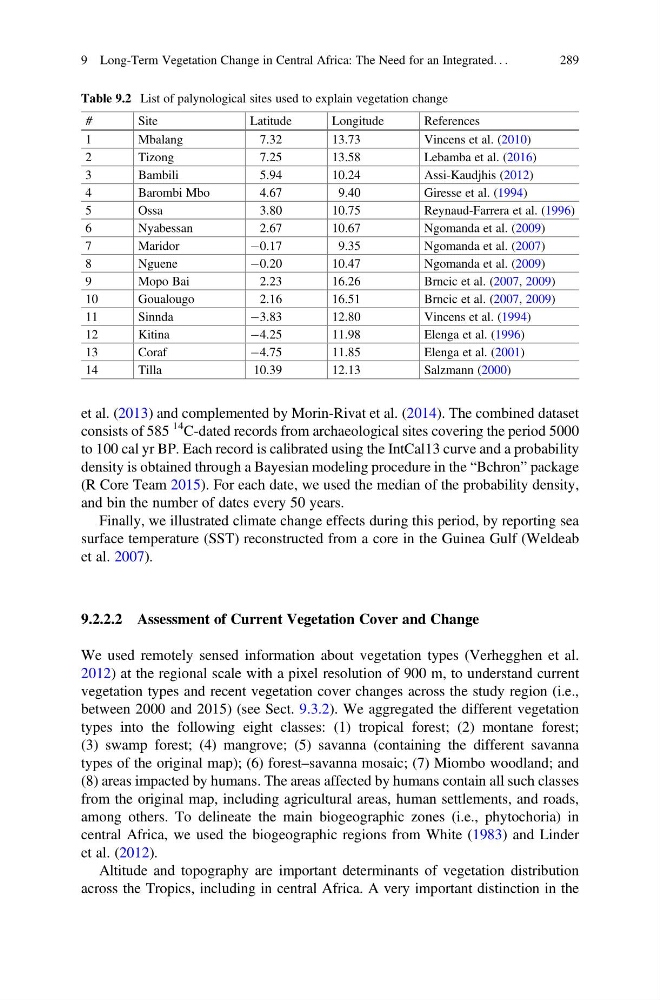
Table 9.2 List of palynological sites used to explain vegetation change
#
Site
Latitude
Longitude
References
1
Mbalang
7.32
13.73
Vincens et al. (2010)
2
Tizong
7.25
13.58
Lebamba et al. (2016)
3
Bambili
5.94
10.24
Assi-Kaudjhis (2012)
4
Barombi Mbo
4.67
9.40
Giresse et al. (1994)
5
Ossa
3.80
10.75
Reynaud-Farrera et al. (1996)
6
Nyabessan
2.67
10.67
Ngomanda et al. (2009)
7
Maridor
À0.17
9.35
Ngomanda et al. (2007)
8
Nguene
À0.20
10.47
Ngomanda et al. (2009)
9
Mopo Bai
2.23
16.26
Brncic et al. (2007, 2009)
10
Goualougo
2.16
16.51
Brncic et al. (2007, 2009)
11
Sinnda
À3.83
12.80
Vincens et al. (1994)
12
Kitina
À4.25
11.98
Elenga et al. (1996)
13
Coraf
À4.75
11.85
Elenga et al. (2001)
14
Tilla
10.39
12.13
Salzmann (2000)
9 Long-Term Vegetation Change in Central Africa: The Need for an Integrated. . .
289
consists of 585
14 C-dated records from archaeological sites covering the period 5000
to 100 cal yr BP. Each record is calibrated using the IntCal13 curve and a probability
density is obtained through a Bayesian modeling procedure in the “Bchron” package
(R Core Team 2015). For each date, we used the median of the probability density,
and bin the number of dates every 50 years.
Finally, we illustrated climate change effects during this period, by reporting sea
surface temperature (SST) reconstructed from a core in the Guinea Gulf (Weldeab
et al. 2007).
9.2.2.2 Assessment of Current Vegetation Cover and Change
We used remotely sensed information about vegetation types (Verhegghen et al.
2012) at the regional scale with a pixel resolution of 900 m, to understand current
vegetation types and recent vegetation cover changes across the study region (i.e.,
between 2000 and 2015) (see Sect. 9.3.2). We aggregated the different vegetation
types into the following eight classes: (1) tropical forest; (2) montane forest;
(3) swamp forest; (4) mangrove; (5) savanna (containing the different savanna
types of the original map); (6) forest–savanna mosaic; (7) Miombo woodland; and
(8) areas impacted by humans. The areas affected by humans contain all such classes
from the original map, including agricultural areas, human settlements, and roads,
among others. To delineate the main biogeographic zones (i.e., phytochoria) in
central Africa, we used the biogeographic regions from White (1983) and Linder
et al. (2012).
Altitude and topography are important determinants of vegetation distribution
across the Tropics, including in central Africa. A very important distinction in the
Table 9.2 List of palynological sites used to explain vegetation change
#
Site
Latitude
Longitude
References
1
Mbalang
7.32
13.73
Vincens et al. (2010)
2
Tizong
7.25
13.58
Lebamba et al. (2016)
3
Bambili
5.94
10.24
Assi-Kaudjhis (2012)
4
Barombi Mbo
4.67
9.40
Giresse et al. (1994)
5
Ossa
3.80
10.75
Reynaud-Farrera et al. (1996)
6
Nyabessan
2.67
10.67
Ngomanda et al. (2009)
7
Maridor
À0.17
9.35
Ngomanda et al. (2007)
8
Nguene
À0.20
10.47
Ngomanda et al. (2009)
9
Mopo Bai
2.23
16.26
Brncic et al. (2007, 2009)
10
Goualougo
2.16
16.51
Brncic et al. (2007, 2009)
11
Sinnda
À3.83
12.80
Vincens et al. (1994)
12
Kitina
À4.25
11.98
Elenga et al. (1996)
13
Coraf
À4.75
11.85
Elenga et al. (2001)
14
Tilla
10.39
12.13
Salzmann (2000)
9 Long-Term Vegetation Change in Central Africa: The Need for an Integrated. . .
289