

28
N. Sifakis et al.
1,134
923
797
764
760
768
400
500
600
700
800
900
1000
1100
1200
2011
2012
2013
2014
2015
2016
2017
2018
Energy consumpƟon per student [kWh/std]
Year
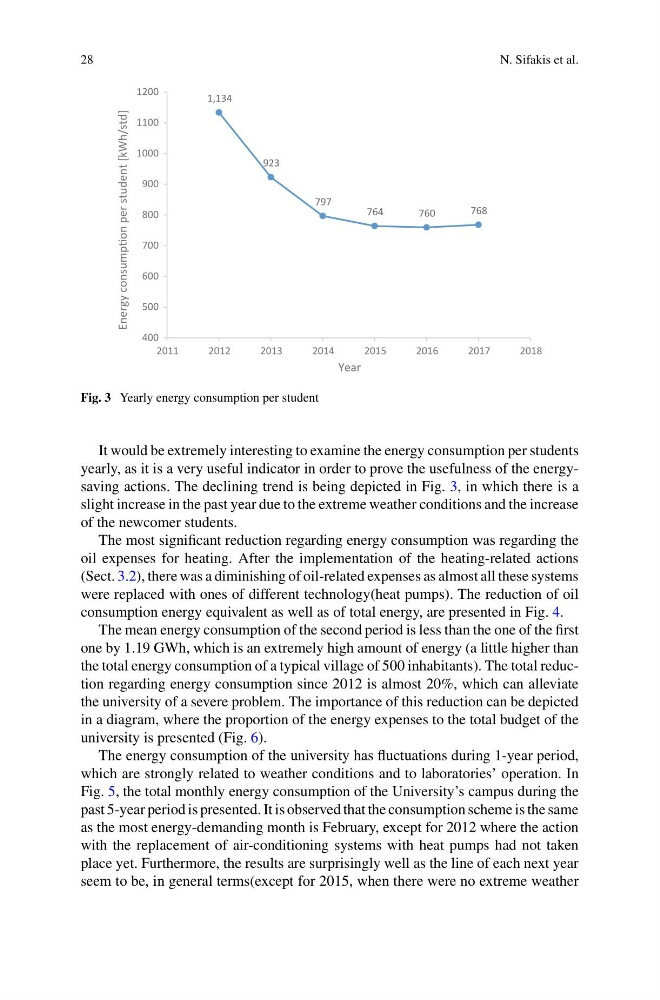
Fig. 3 Yearly energy consumption per student
It would be extremely interesting to examine the energy consumption per students
yearly, as it is a very useful indicator in order to prove the usefulness of the energysaving actions. The declining trend is being depicted in Fig. 3, in which there is a
slight increase in the past year due to the extreme weather conditions and the increase
of the newcomer students.
The most significant reduction regarding energy consumption was regarding the
oil expenses for heating. After the implementation of the heating-related actions
(Sect. 3.2), there was a diminishing of oil-related expenses as almost all these systems
were replaced with ones of different technology(heat pumps). The reduction of oil
consumption energy equivalent as well as of total energy, are presented in Fig. 4.
The mean energy consumption of the second period is less than the one of the first
one by 1.19 GWh, which is an extremely high amount of energy (a little higher than
the total energy consumption of a typical village of 500 inhabitants). The total reduction regarding energy consumption since 2012 is almost 20%, which can alleviate
the university of a severe problem. The importance of this reduction can be depicted
in a diagram, where the proportion of the energy expenses to the total budget of the
university is presented (Fig. 6).
The energy consumption of the university has fluctuations during 1-year period,
which are strongly related to weather conditions and to laboratories’ operation. In
Fig. 5, the total monthly energy consumption of the University’s campus during the
past 5-year period is presented. It is observed that the consumption scheme is the same
as the most energy-demanding month is February, except for 2012 where the action
with the replacement of air-conditioning systems with heat pumps had not taken
place yet. Furthermore, the results are surprisingly well as the line of each next year
seem to be, in general terms(except for 2015, when there were no extreme weather
N. Sifakis et al.
1,134
923
797
764
760
768
400
500
600
700
800
900
1000
1100
1200
2011
2012
2013
2014
2015
2016
2017
2018
Energy consumpƟon per student [kWh/std]
Year
Fig. 3 Yearly energy consumption per student
It would be extremely interesting to examine the energy consumption per students
yearly, as it is a very useful indicator in order to prove the usefulness of the energysaving actions. The declining trend is being depicted in Fig. 3, in which there is a
slight increase in the past year due to the extreme weather conditions and the increase
of the newcomer students.
The most significant reduction regarding energy consumption was regarding the
oil expenses for heating. After the implementation of the heating-related actions
(Sect. 3.2), there was a diminishing of oil-related expenses as almost all these systems
were replaced with ones of different technology(heat pumps). The reduction of oil
consumption energy equivalent as well as of total energy, are presented in Fig. 4.
The mean energy consumption of the second period is less than the one of the first
one by 1.19 GWh, which is an extremely high amount of energy (a little higher than
the total energy consumption of a typical village of 500 inhabitants). The total reduction regarding energy consumption since 2012 is almost 20%, which can alleviate
the university of a severe problem. The importance of this reduction can be depicted
in a diagram, where the proportion of the energy expenses to the total budget of the
university is presented (Fig. 6).
The energy consumption of the university has fluctuations during 1-year period,
which are strongly related to weather conditions and to laboratories’ operation. In
Fig. 5, the total monthly energy consumption of the University’s campus during the
past 5-year period is presented. It is observed that the consumption scheme is the same
as the most energy-demanding month is February, except for 2012 where the action
with the replacement of air-conditioning systems with heat pumps had not taken
place yet. Furthermore, the results are surprisingly well as the line of each next year
seem to be, in general terms(except for 2015, when there were no extreme weather