

138
N. Wid and L. F. Ayut
45.73
19.68
12.59
7.96
6.18
3.96
3.28 0.62
Vegetable & fruit peels
Chicken & fish bones
Others
Egg shells
Onion & garlic skins
Waste cooking oil
Tea leaves & coffee dregs
Unused part of meats
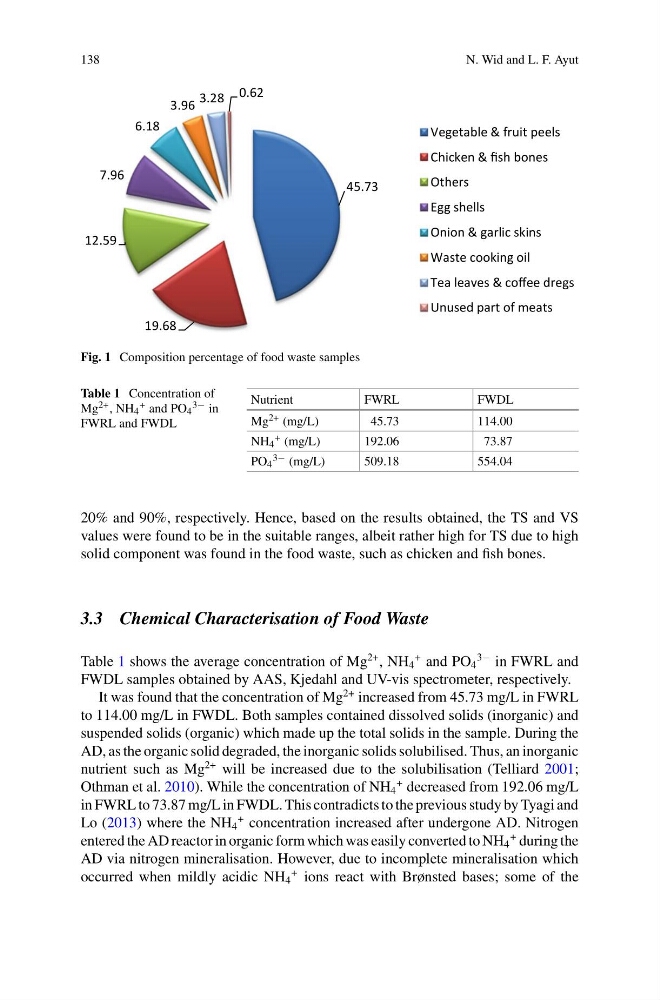
Fig. 1 Composition percentage of food waste samples
Table 1 Concentration of
Mg 2+ , NH 4
+ and PO 4
3− in
FWRL and FWDL
Nutrient
FWRL
FWDL
Mg 2+ (mg/L)
45.73
114.00
NH 4
+ (mg/L)
192.06
73.87
PO 4
3− (mg/L)
509.18
554.04
20% and 90%, respectively. Hence, based on the results obtained, the TS and VS
values were found to be in the suitable ranges, albeit rather high for TS due to high
solid component was found in the food waste, such as chicken and fish bones.
3.3 Chemical Characterisation of Food Waste
Table 1 shows the average concentration of Mg
2+ , NH 4
+ and PO 4
3− in FWRL and
FWDL samples obtained by AAS, Kjedahl and UV-vis spectrometer, respectively.
It was found that the concentration of Mg
2+ increased from 45.73 mg/L in FWRL
to 114.00 mg/L in FWDL. Both samples contained dissolved solids (inorganic) and
suspended solids (organic) which made up the total solids in the sample. During the
AD, as the organic solid degraded, the inorganic solids solubilised. Thus, an inorganic
nutrient such as Mg
2+ will be increased due to the solubilisation (Telliard 2001;
Othman et al. 2010). While the concentration of NH 4
+ decreased from 192.06 mg/L
in FWRL to 73.87 mg/L in FWDL. This contradicts to the previous study by Tyagi and
Lo (2013) where the NH 4
+ concentration increased after undergone AD. Nitrogen
entered the AD reactor in organic form which was easily converted to NH 4
+ during the
AD via nitrogen mineralisation. However, due to incomplete mineralisation which
occurred when mildly acidic NH 4
+ ions react with Brønsted bases; some of the
N. Wid and L. F. Ayut
45.73
19.68
12.59
7.96
6.18
3.96
3.28 0.62
Vegetable & fruit peels
Chicken & fish bones
Others
Egg shells
Onion & garlic skins
Waste cooking oil
Tea leaves & coffee dregs
Unused part of meats
Fig. 1 Composition percentage of food waste samples
Table 1 Concentration of
Mg 2+ , NH 4
+ and PO 4
3− in
FWRL and FWDL
Nutrient
FWRL
FWDL
Mg 2+ (mg/L)
45.73
114.00
NH 4
+ (mg/L)
192.06
73.87
PO 4
3− (mg/L)
509.18
554.04
20% and 90%, respectively. Hence, based on the results obtained, the TS and VS
values were found to be in the suitable ranges, albeit rather high for TS due to high
solid component was found in the food waste, such as chicken and fish bones.
3.3 Chemical Characterisation of Food Waste
Table 1 shows the average concentration of Mg
2+ , NH 4
+ and PO 4
3− in FWRL and
FWDL samples obtained by AAS, Kjedahl and UV-vis spectrometer, respectively.
It was found that the concentration of Mg
2+ increased from 45.73 mg/L in FWRL
to 114.00 mg/L in FWDL. Both samples contained dissolved solids (inorganic) and
suspended solids (organic) which made up the total solids in the sample. During the
AD, as the organic solid degraded, the inorganic solids solubilised. Thus, an inorganic
nutrient such as Mg
2+ will be increased due to the solubilisation (Telliard 2001;
Othman et al. 2010). While the concentration of NH 4
+ decreased from 192.06 mg/L
in FWRL to 73.87 mg/L in FWDL. This contradicts to the previous study by Tyagi and
Lo (2013) where the NH 4
+ concentration increased after undergone AD. Nitrogen
entered the AD reactor in organic form which was easily converted to NH 4
+ during the
AD via nitrogen mineralisation. However, due to incomplete mineralisation which
occurred when mildly acidic NH 4
+ ions react with Brønsted bases; some of the