

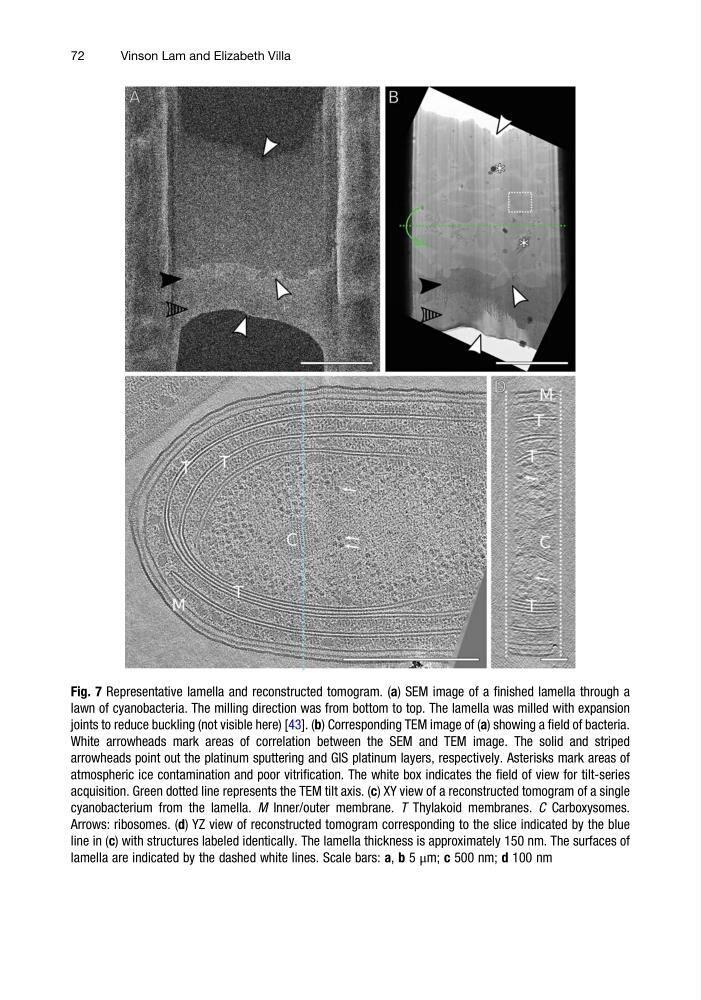
Fig. 7 Representative lamella and reconstructed tomogram. (a) SEM image of a finished lamella through a
lawn of cyanobacteria. The milling direction was from bottom to top. The lamella was milled with expansion
joints to reduce buckling (not visible here) [43]. (b) Corresponding TEM image of (a) showing a field of bacteria.
White arrowheads mark areas of correlation between the SEM and TEM image. The solid and striped
arrowheads point out the platinum sputtering and GIS platinum layers, respectively. Asterisks mark areas of
atmospheric ice contamination and poor vitrification. The white box indicates the field of view for tilt-series
acquisition. Green dotted line represents the TEM tilt axis. (c) XY view of a reconstructed tomogram of a single
cyanobacterium from the lamella. M Inner/outer membrane. T Thylakoid membranes. C Carboxysomes.
Arrows: ribosomes. (d) YZ view of reconstructed tomogram corresponding to the slice indicated by the blue
line in (c) with structures labeled identically. The lamella thickness is approximately 150 nm. The surfaces of
lamella are indicated by the dashed white lines. Scale bars: a, b 5 μm; c 500 nm; d 100 nm
72
Vinson Lam and Elizabeth Villa
lawn of cyanobacteria. The milling direction was from bottom to top. The lamella was milled with expansion
joints to reduce buckling (not visible here) [43]. (b) Corresponding TEM image of (a) showing a field of bacteria.
White arrowheads mark areas of correlation between the SEM and TEM image. The solid and striped
arrowheads point out the platinum sputtering and GIS platinum layers, respectively. Asterisks mark areas of
atmospheric ice contamination and poor vitrification. The white box indicates the field of view for tilt-series
acquisition. Green dotted line represents the TEM tilt axis. (c) XY view of a reconstructed tomogram of a single
cyanobacterium from the lamella. M Inner/outer membrane. T Thylakoid membranes. C Carboxysomes.
Arrows: ribosomes. (d) YZ view of reconstructed tomogram corresponding to the slice indicated by the blue
line in (c) with structures labeled identically. The lamella thickness is approximately 150 nm. The surfaces of
lamella are indicated by the dashed white lines. Scale bars: a, b 5 μm; c 500 nm; d 100 nm
72
Vinson Lam and Elizabeth Villa