

exposure setting is only used to optimize the exact positioning of
the target. The time-step for the live mode view should be set to a
minimum that allows for just enough signal to center the object as
quickly as possible.
3.6.7 Saving Tilt-Series
Positions
In the “Tomography” tab, select “Apply”, then click “Acquire” in
the “Prepare Position” section of the “Tomography” tab. The first
time this tab is used, a prompt will appear to create a new session
and determine where the files will be stored during data collection.
Set the specimen type to “slab-like” and check the “Low Dose”
box. To collect more than one tilt-series, check the “Batch” box.
Wait for the image of the target to appear. There should be three
colored circles over the image. The yellow circle represents the size
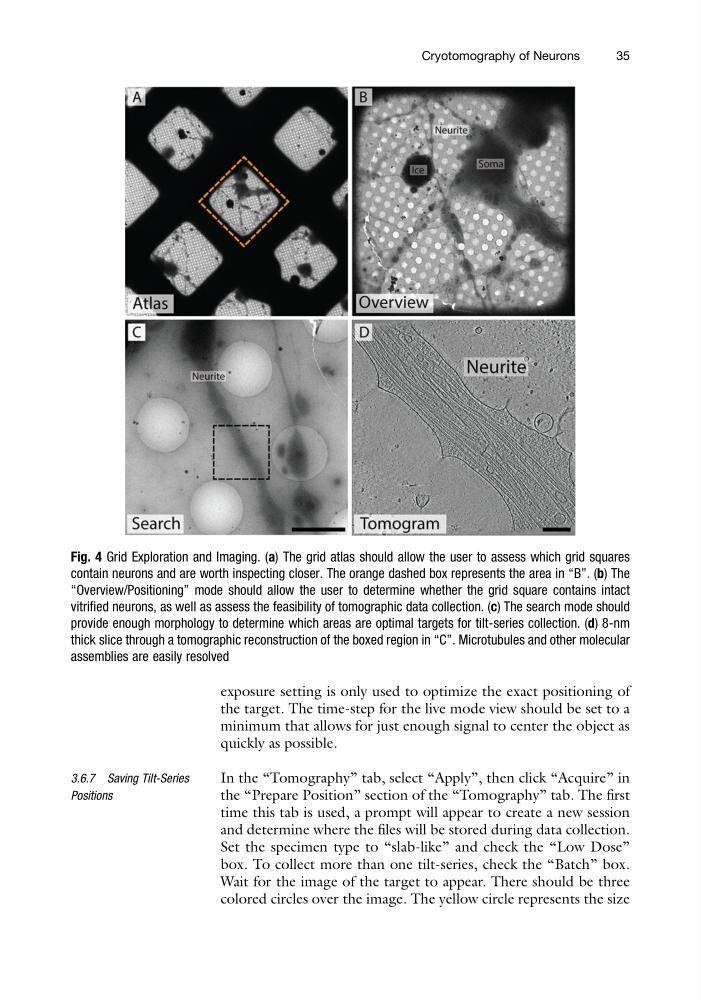
Fig. 4 Grid Exploration and Imaging. (a) The grid atlas should allow the user to assess which grid squares
contain neurons and are worth inspecting closer. The orange dashed box represents the area in “B”. (b) The
“Overview/Positioning” mode should allow the user to determine whether the grid square contains intact
vitrified neurons, as well as assess the feasibility of tomographic data collection. (c) The search mode should
provide enough morphology to determine which areas are optimal targets for tilt-series collection. (d) 8-nm
thick slice through a tomographic reconstruction of the boxed region in “C”. Microtubules and other molecular
assemblies are easily resolved
Cryotomography of Neurons
35
the target. The time-step for the live mode view should be set to a
minimum that allows for just enough signal to center the object as
quickly as possible.
3.6.7 Saving Tilt-Series
Positions
In the “Tomography” tab, select “Apply”, then click “Acquire” in
the “Prepare Position” section of the “Tomography” tab. The first
time this tab is used, a prompt will appear to create a new session
and determine where the files will be stored during data collection.
Set the specimen type to “slab-like” and check the “Low Dose”
box. To collect more than one tilt-series, check the “Batch” box.
Wait for the image of the target to appear. There should be three
colored circles over the image. The yellow circle represents the size
Fig. 4 Grid Exploration and Imaging. (a) The grid atlas should allow the user to assess which grid squares
contain neurons and are worth inspecting closer. The orange dashed box represents the area in “B”. (b) The
“Overview/Positioning” mode should allow the user to determine whether the grid square contains intact
vitrified neurons, as well as assess the feasibility of tomographic data collection. (c) The search mode should
provide enough morphology to determine which areas are optimal targets for tilt-series collection. (d) 8-nm
thick slice through a tomographic reconstruction of the boxed region in “C”. Microtubules and other molecular
assemblies are easily resolved
Cryotomography of Neurons
35