

live view. Adjust the beam intensity and spot size until you have the
desired illumination area and a dose measurement between 8 and
10 electrons/pixel/s. Save the current beam setting by selecting
“get” on the preparation tab. This is the optimal range for the K2
to detect single electron events. Now move back over the broken
hole in the carbon and read the electrons/pixel/sec without the
sample in the beam path. This number represents the electron dose
your sample is actually experiencing. Use the following formula to
calculate the exposure time with the desired beam setting:
Exposure time s
ð Þ ¼ Dose total e=Å
2
∗ Pixel size Å
À Á
À
Á 2
h
i
= Dose measured e=pix=s
ð
Þ∗ Total images
ð
Þ
½
where
Dose total is the desired total cumulative electron dose, typically
100–200 e/Å
2 .
Pixel size is determined by the collection magnification.
Dose measured is the number of electrons measured with no
sample.
Total images is the number of images collected during the tiltseries, which depends on the tilt range and increment. For example:
there are 121 images in a tilt-series from À60 to 60 in one-degree
increments.
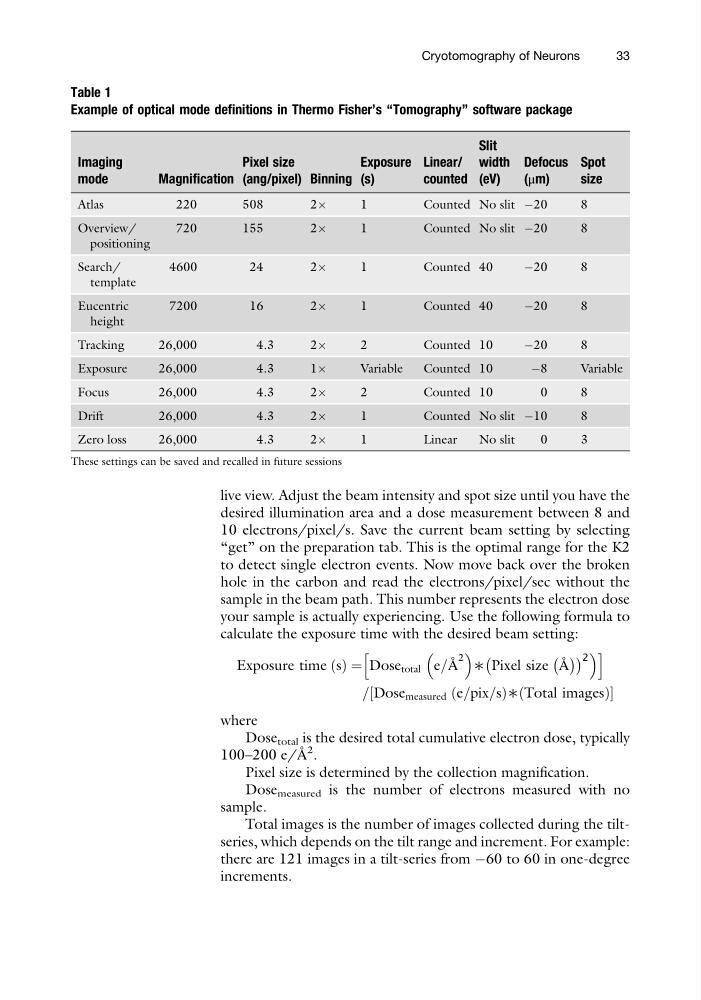
Table 1
Example of optical mode definitions in Thermo Fisher’s “Tomography” software package
Imaging
mode
Magnification
Pixel size
(ang/pixel) Binning
Exposure
(s)
Linear/
counted
Slit
width
(eV)
Defocus
(μm)
Spot
size
Atlas
220
508
2Â
1
Counted No slit À20
8
Overview/
positioning
720
155
2Â
1
Counted No slit À20
8
Search/
template
4600
24
2Â
1
Counted 40
À20
8
Eucentric
height
7200
16
2Â
1
Counted 40
À20
8
Tracking
26,000
4.3
2Â
2
Counted 10
À20
8
Exposure
26,000
4.3
1Â
Variable
Counted 10
À8
Variable
Focus
26,000
4.3
2Â
2
Counted 10
0
8
Drift
26,000
4.3
2Â
1
Counted No slit À10
8
Zero loss
26,000
4.3
2Â
1
Linear
No slit
0
3
These settings can be saved and recalled in future sessions
Cryotomography of Neurons
33
desired illumination area and a dose measurement between 8 and
10 electrons/pixel/s. Save the current beam setting by selecting
“get” on the preparation tab. This is the optimal range for the K2
to detect single electron events. Now move back over the broken
hole in the carbon and read the electrons/pixel/sec without the
sample in the beam path. This number represents the electron dose
your sample is actually experiencing. Use the following formula to
calculate the exposure time with the desired beam setting:
Exposure time s
ð Þ ¼ Dose total e=Å
2
∗ Pixel size Å
À Á
À
Á 2
h
i
= Dose measured e=pix=s
ð
Þ∗ Total images
ð
Þ
½
where
Dose total is the desired total cumulative electron dose, typically
100–200 e/Å
2 .
Pixel size is determined by the collection magnification.
Dose measured is the number of electrons measured with no
sample.
Total images is the number of images collected during the tiltseries, which depends on the tilt range and increment. For example:
there are 121 images in a tilt-series from À60 to 60 in one-degree
increments.
Table 1
Example of optical mode definitions in Thermo Fisher’s “Tomography” software package
Imaging
mode
Magnification
Pixel size
(ang/pixel) Binning
Exposure
(s)
Linear/
counted
Slit
width
(eV)
Defocus
(μm)
Spot
size
Atlas
220
508
2Â
1
Counted No slit À20
8
Overview/
positioning
720
155
2Â
1
Counted No slit À20
8
Search/
template
4600
24
2Â
1
Counted 40
À20
8
Eucentric
height
7200
16
2Â
1
Counted 40
À20
8
Tracking
26,000
4.3
2Â
2
Counted 10
À20
8
Exposure
26,000
4.3
1Â
Variable
Counted 10
À8
Variable
Focus
26,000
4.3
2Â
2
Counted 10
0
8
Drift
26,000
4.3
2Â
1
Counted No slit À10
8
Zero loss
26,000
4.3
2Â
1
Linear
No slit
0
3
These settings can be saved and recalled in future sessions
Cryotomography of Neurons
33