

4 Notes
1. The final volume of the crystallization drop should be around
1 μL, therefore about 1.0 μL protein stock solution and 1.0 μL
reservoir buffer should be used to set up each initial crystallization drop due to evaporation process during the crystallization
experiment. The exact values and ratio between protein and
reservoir solution will depend on the specific “crystallizability”
of each protein of interest.
2. The initial screening of the crystallization tray should identify
conditions displaying a significant amount of “shiny” aggregate
(see Fig. 1 for examples). This screening is best performed at
magnifications of 30–100Â. In order to obtain the best possible image quality and differentiate between shiny and
non-shiny aggregate the experimenter might need to change
the polarization and contrast settings of the microscope. It is
advised to especially look for any type of shape (e.g., needle like
or other symmetric structures), which are likely indicators for
the presence of nanocrystals.
3. Crystal drops containing granular aggregates under BF microscopy are selected for further evaluation using ultraviolet
(UV) microscopy (Jansi, Molecular Dimensions). UV positive
granular aggregates can be easily discerned with the use of a
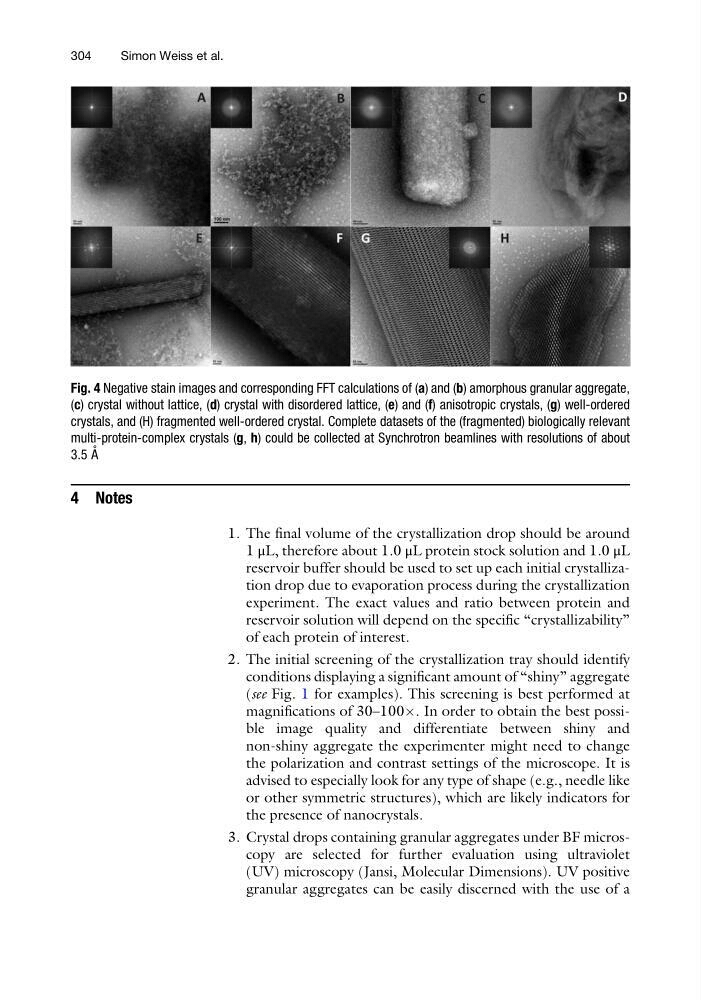
Fig. 4 Negative stain images and corresponding FFT calculations of (a) and (b) amorphous granular aggregate,
(c) crystal without lattice, (d) crystal with disordered lattice, (e) and (f) anisotropic crystals, (g) well-ordered
crystals, and (H) fragmented well-ordered crystal. Complete datasets of the (fragmented) biologically relevant
multi-protein-complex crystals (g, h) could be collected at Synchrotron beamlines with resolutions of about
3.5 A ˚
304
Simon Weiss et al.
1. The final volume of the crystallization drop should be around
1 μL, therefore about 1.0 μL protein stock solution and 1.0 μL
reservoir buffer should be used to set up each initial crystallization drop due to evaporation process during the crystallization
experiment. The exact values and ratio between protein and
reservoir solution will depend on the specific “crystallizability”
of each protein of interest.
2. The initial screening of the crystallization tray should identify
conditions displaying a significant amount of “shiny” aggregate
(see Fig. 1 for examples). This screening is best performed at
magnifications of 30–100Â. In order to obtain the best possible image quality and differentiate between shiny and
non-shiny aggregate the experimenter might need to change
the polarization and contrast settings of the microscope. It is
advised to especially look for any type of shape (e.g., needle like
or other symmetric structures), which are likely indicators for
the presence of nanocrystals.
3. Crystal drops containing granular aggregates under BF microscopy are selected for further evaluation using ultraviolet
(UV) microscopy (Jansi, Molecular Dimensions). UV positive
granular aggregates can be easily discerned with the use of a
Fig. 4 Negative stain images and corresponding FFT calculations of (a) and (b) amorphous granular aggregate,
(c) crystal without lattice, (d) crystal with disordered lattice, (e) and (f) anisotropic crystals, (g) well-ordered
crystals, and (H) fragmented well-ordered crystal. Complete datasets of the (fragmented) biologically relevant
multi-protein-complex crystals (g, h) could be collected at Synchrotron beamlines with resolutions of about
3.5 A ˚
304
Simon Weiss et al.