

2. Use the program “imod-dist” to extract information on distances between features.
3. Use “boxstartend” to extract subtomograms around the modeled features.
4. Use “model2point” to extract coordinates in ascii (text
format).
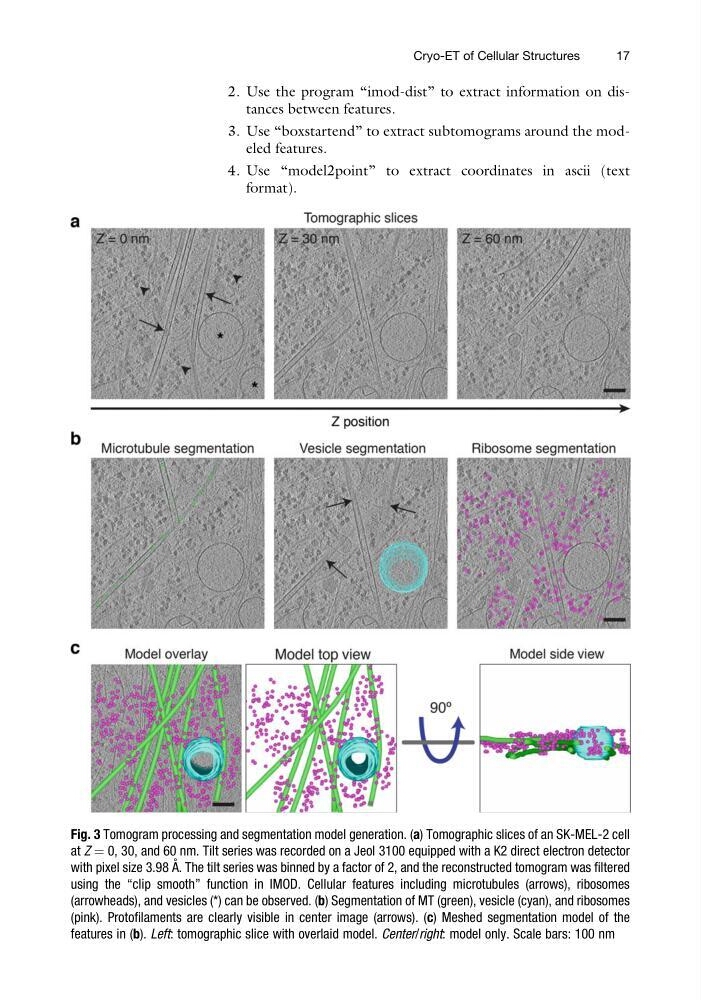
Fig. 3 Tomogram processing and segmentation model generation. (a) Tomographic slices of an SK-MEL-2 cell
at Z ¼ 0, 30, and 60 nm. Tilt series was recorded on a Jeol 3100 equipped with a K2 direct electron detector
with pixel size 3.98 A ˚ . The tilt series was binned by a factor of 2, and the reconstructed tomogram was filtered
using the “clip smooth” function in IMOD. Cellular features including microtubules (arrows), ribosomes
(arrowheads), and vesicles (*) can be observed. (b) Segmentation of MT (green), vesicle (cyan), and ribosomes
(pink). Protofilaments are clearly visible in center image (arrows). (c) Meshed segmentation model of the
features in (b). Left: tomographic slice with overlaid model. Center/right: model only. Scale bars: 100 nm
Cryo-ET of Cellular Structures
17
3. Use “boxstartend” to extract subtomograms around the modeled features.
4. Use “model2point” to extract coordinates in ascii (text
format).
Fig. 3 Tomogram processing and segmentation model generation. (a) Tomographic slices of an SK-MEL-2 cell
at Z ¼ 0, 30, and 60 nm. Tilt series was recorded on a Jeol 3100 equipped with a K2 direct electron detector
with pixel size 3.98 A ˚ . The tilt series was binned by a factor of 2, and the reconstructed tomogram was filtered
using the “clip smooth” function in IMOD. Cellular features including microtubules (arrows), ribosomes
(arrowheads), and vesicles (*) can be observed. (b) Segmentation of MT (green), vesicle (cyan), and ribosomes
(pink). Protofilaments are clearly visible in center image (arrows). (c) Meshed segmentation model of the
features in (b). Left: tomographic slice with overlaid model. Center/right: model only. Scale bars: 100 nm
Cryo-ET of Cellular Structures
17