

in vivo or in vitro. Some membrane proteins form 2D arrays in their
native membranes, such as S-layer protein [5], bacteriorhodopsin
(bR) [6, 7], aquaporin-0 (AQP0) [8], porin [9], and photosynthetic apparatus [10]. Electron crystallography can be used to
determine the membrane crystal structure and provides a unique
way to probe lipid–protein interaction. The technique has been
successfully used in the studies of bacteriorhodopsin [6], aquaporins [11–18], S-layer [19], lactose permease [20], prokaryotic potassium channel [21–23], galactose transporter [24], photosystem II
[25], glutathione transferase [26], and many other cases. Because
cryo-EM can record the structural data of these membrane proteins
in the context of a lipid bilayer, which is similar to their native
conditions, the electron crystallographic studies of these 2D membrane arrays can thus provide fruitful information of their structures
and how they interact with the surrounding lipids.
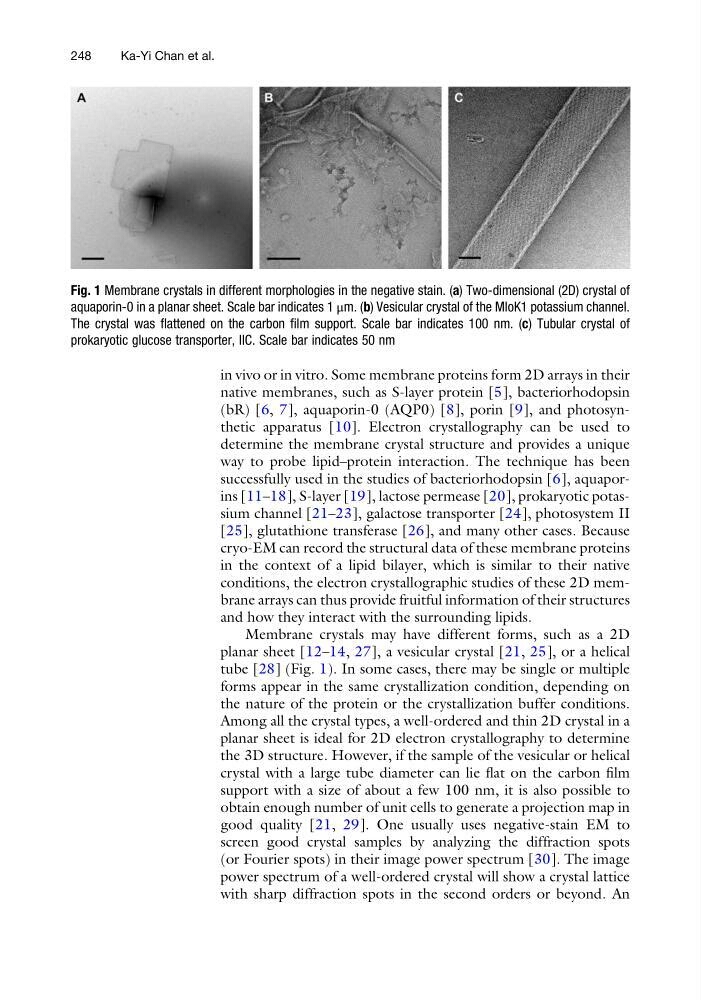
Membrane crystals may have different forms, such as a 2D
planar sheet [12–14, 27], a vesicular crystal [21, 25], or a helical
tube [28] (Fig. 1). In some cases, there may be single or multiple
forms appear in the same crystallization condition, depending on
the nature of the protein or the crystallization buffer conditions.
Among all the crystal types, a well-ordered and thin 2D crystal in a
planar sheet is ideal for 2D electron crystallography to determine
the 3D structure. However, if the sample of the vesicular or helical
crystal with a large tube diameter can lie flat on the carbon film
support with a size of about a few 100 nm, it is also possible to
obtain enough number of unit cells to generate a projection map in
good quality [21, 29]. One usually uses negative-stain EM to
screen good crystal samples by analyzing the diffraction spots
(or Fourier spots) in their image power spectrum [30]. The image
power spectrum of a well-ordered crystal will show a crystal lattice
with sharp diffraction spots in the second orders or beyond. An
Fig. 1 Membrane crystals in different morphologies in the negative stain. (a) Two-dimensional (2D) crystal of
aquaporin-0 in a planar sheet. Scale bar indicates 1 μm. (b) Vesicular crystal of the MloK1 potassium channel.
The crystal was flattened on the carbon film support. Scale bar indicates 100 nm. (c) Tubular crystal of
prokaryotic glucose transporter, IIC. Scale bar indicates 50 nm
248
Ka-Yi Chan et al.
native membranes, such as S-layer protein [5], bacteriorhodopsin
(bR) [6, 7], aquaporin-0 (AQP0) [8], porin [9], and photosynthetic apparatus [10]. Electron crystallography can be used to
determine the membrane crystal structure and provides a unique
way to probe lipid–protein interaction. The technique has been
successfully used in the studies of bacteriorhodopsin [6], aquaporins [11–18], S-layer [19], lactose permease [20], prokaryotic potassium channel [21–23], galactose transporter [24], photosystem II
[25], glutathione transferase [26], and many other cases. Because
cryo-EM can record the structural data of these membrane proteins
in the context of a lipid bilayer, which is similar to their native
conditions, the electron crystallographic studies of these 2D membrane arrays can thus provide fruitful information of their structures
and how they interact with the surrounding lipids.
Membrane crystals may have different forms, such as a 2D
planar sheet [12–14, 27], a vesicular crystal [21, 25], or a helical
tube [28] (Fig. 1). In some cases, there may be single or multiple
forms appear in the same crystallization condition, depending on
the nature of the protein or the crystallization buffer conditions.
Among all the crystal types, a well-ordered and thin 2D crystal in a
planar sheet is ideal for 2D electron crystallography to determine
the 3D structure. However, if the sample of the vesicular or helical
crystal with a large tube diameter can lie flat on the carbon film
support with a size of about a few 100 nm, it is also possible to
obtain enough number of unit cells to generate a projection map in
good quality [21, 29]. One usually uses negative-stain EM to
screen good crystal samples by analyzing the diffraction spots
(or Fourier spots) in their image power spectrum [30]. The image
power spectrum of a well-ordered crystal will show a crystal lattice
with sharp diffraction spots in the second orders or beyond. An
Fig. 1 Membrane crystals in different morphologies in the negative stain. (a) Two-dimensional (2D) crystal of
aquaporin-0 in a planar sheet. Scale bar indicates 1 μm. (b) Vesicular crystal of the MloK1 potassium channel.
The crystal was flattened on the carbon film support. Scale bar indicates 100 nm. (c) Tubular crystal of
prokaryotic glucose transporter, IIC. Scale bar indicates 50 nm
248
Ka-Yi Chan et al.