

In the case of Kinesin-8/BTB-1 complex [55] to improve
poorly fit loop regions (identified with SMOCf) the loop optimization was used to generate 250 models per loop and the top-scoring
conformations were selected based on the SCCC of the loop.
Regions of scores at the lower 50% percentile and residues within
5 A ˚ of them were subjected to further all-atom refinement and this
process was repeated iteratively until more than 80% of the regions
fitted with SCCC score values higher than 0.85 (the scores of the
best-fitted regions were in the range of 0.92–0.93).
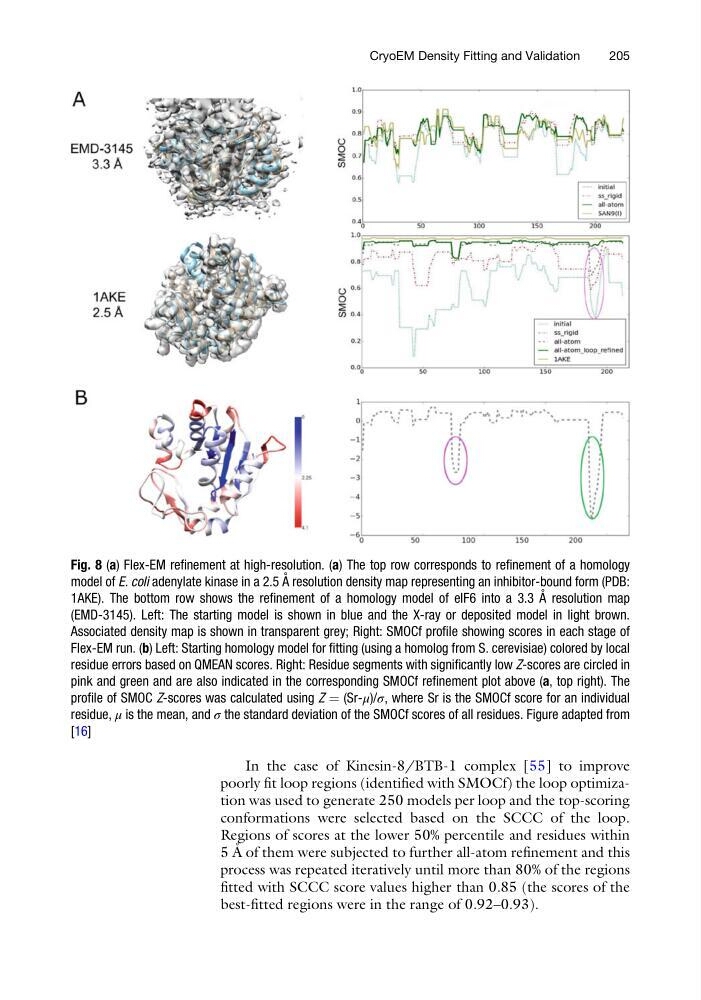
Fig. 8 (a) Flex-EM refinement at high-resolution. (a) The top row corresponds to refinement of a homology
model of E. coli adenylate kinase in a 2.5 A ˚ resolution density map representing an inhibitor-bound form (PDB:
1AKE). The bottom row shows the refinement of a homology model of eIF6 into a 3.3 A ˚ resolution map
(EMD-3145). Left: The starting model is shown in blue and the X-ray or deposited model in light brown.
Associated density map is shown in transparent grey; Right: SMOCf profile showing scores in each stage of
Flex-EM run. (b) Left: Starting homology model for fitting (using a homolog from S. cerevisiae) colored by local
residue errors based on QMEAN scores. Right: Residue segments with significantly low Z-scores are circled in
pink and green and are also indicated in the corresponding SMOCf refinement plot above (a, top right). The
profile of SMOC Z-scores was calculated using Z ¼ (Sr-μ)/σ, where Sr is the SMOCf score for an individual
residue, μ is the mean, and σ the standard deviation of the SMOCf scores of all residues. Figure adapted from
[16]
CryoEM Density Fitting and Validation
205
poorly fit loop regions (identified with SMOCf) the loop optimization was used to generate 250 models per loop and the top-scoring
conformations were selected based on the SCCC of the loop.
Regions of scores at the lower 50% percentile and residues within
5 A ˚ of them were subjected to further all-atom refinement and this
process was repeated iteratively until more than 80% of the regions
fitted with SCCC score values higher than 0.85 (the scores of the
best-fitted regions were in the range of 0.92–0.93).
Fig. 8 (a) Flex-EM refinement at high-resolution. (a) The top row corresponds to refinement of a homology
model of E. coli adenylate kinase in a 2.5 A ˚ resolution density map representing an inhibitor-bound form (PDB:
1AKE). The bottom row shows the refinement of a homology model of eIF6 into a 3.3 A ˚ resolution map
(EMD-3145). Left: The starting model is shown in blue and the X-ray or deposited model in light brown.
Associated density map is shown in transparent grey; Right: SMOCf profile showing scores in each stage of
Flex-EM run. (b) Left: Starting homology model for fitting (using a homolog from S. cerevisiae) colored by local
residue errors based on QMEAN scores. Right: Residue segments with significantly low Z-scores are circled in
pink and green and are also indicated in the corresponding SMOCf refinement plot above (a, top right). The
profile of SMOC Z-scores was calculated using Z ¼ (Sr-μ)/σ, where Sr is the SMOCf score for an individual
residue, μ is the mean, and σ the standard deviation of the SMOCf scores of all residues. Figure adapted from
[16]
CryoEM Density Fitting and Validation
205