

Assignment of local resolution values to individual voxel centroids
and scanning the patches across the map produces a 3D array of
local resolution values, the same size as the reconstructed object.
This local resolution file can be opened and visualized just like any
density within a visualization program (e.g., UCSF Chimera)
[14]. The reconstructed object is colored by the values of the
local resolution file.
Variations in local resolution arise from intrinsic dynamics
inherent to macromolecules and macromolecular assemblies, from
differences in the (dis)assembly state of macromolecular species, or
can also be affected by errors in orientation assignment.
Because averaging many particles into a 3D reconstruction is an
inherent aspect of single-particle analysis, variations in local resolution, more generally, describe differences in the structural states of
individual protein particles within averaged ensemble reconstructions. In practice, most specimens in cryo-EM have at least some
amount of heterogeneity. Virtually all macromolecules are better
ordered, and therefore better resolved, within their central core
regions that are tightly packed and occluded from solvent molecules. In contrast, protein loops and solvent exposed regions often
respond dynamically to changing cellular environments and are
thus typically resolved to lower resolutions. There can also be
multiple different species in the sample (e.g., from transiently or
sub-stoichiometrically associated components) and apparent compositional heterogeneity can also result from protein degradation,
or denaturation at the air–water interface during plunge freezing
[15]. All of these result in lower resolution in specific regions. The
inclusion of a local resolution analysis is therefore essential to
properly evaluate a reconstructed map. Loss of resolution from
some local region does not necessarily correspond to any particular
direction in Fourier space, so that the directional resolution, as we
have defined it and will be described next, may not be very informative for such types of errors.
To define the directional resolution, it is possible to investigate
the agreement of F and G over specific viewing angles. One could
alter the calculation and determine the resolution in cones. As
adapted from earlier concepts applied in tomography [16, 17], we
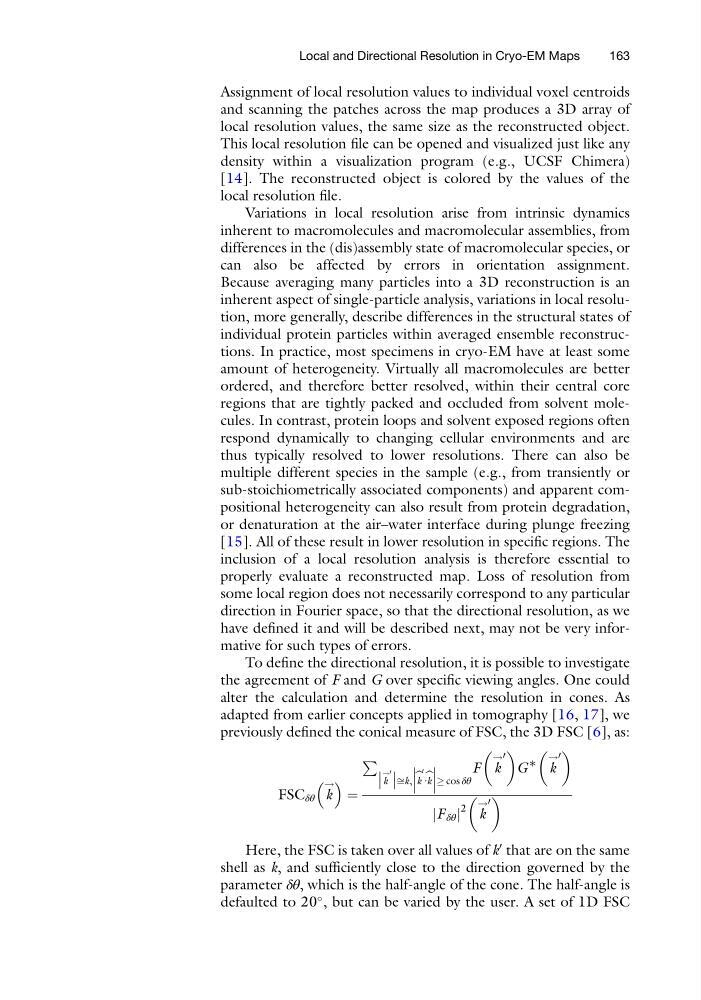
previously defined the conical measure of FSC, the 3D FSC [6], as:
FSC δθ k
!
¼
P
k
!0
ffik, b k
0
∙ b k
! cos δθ
F k
! 0
G
∗
k
! 0
F δθ
j j
2 k
! 0
Here, the FSC is taken over all values of k
0 that are on the same
shell as k, and sufficiently close to the direction governed by the
parameter δθ, which is the half-angle of the cone. The half-angle is
defaulted to 20
, but can be varied by the user. A set of 1D FSC
Local and Directional Resolution in Cryo-EM Maps
163
and scanning the patches across the map produces a 3D array of
local resolution values, the same size as the reconstructed object.
This local resolution file can be opened and visualized just like any
density within a visualization program (e.g., UCSF Chimera)
[14]. The reconstructed object is colored by the values of the
local resolution file.
Variations in local resolution arise from intrinsic dynamics
inherent to macromolecules and macromolecular assemblies, from
differences in the (dis)assembly state of macromolecular species, or
can also be affected by errors in orientation assignment.
Because averaging many particles into a 3D reconstruction is an
inherent aspect of single-particle analysis, variations in local resolution, more generally, describe differences in the structural states of
individual protein particles within averaged ensemble reconstructions. In practice, most specimens in cryo-EM have at least some
amount of heterogeneity. Virtually all macromolecules are better
ordered, and therefore better resolved, within their central core
regions that are tightly packed and occluded from solvent molecules. In contrast, protein loops and solvent exposed regions often
respond dynamically to changing cellular environments and are
thus typically resolved to lower resolutions. There can also be
multiple different species in the sample (e.g., from transiently or
sub-stoichiometrically associated components) and apparent compositional heterogeneity can also result from protein degradation,
or denaturation at the air–water interface during plunge freezing
[15]. All of these result in lower resolution in specific regions. The
inclusion of a local resolution analysis is therefore essential to
properly evaluate a reconstructed map. Loss of resolution from
some local region does not necessarily correspond to any particular
direction in Fourier space, so that the directional resolution, as we
have defined it and will be described next, may not be very informative for such types of errors.
To define the directional resolution, it is possible to investigate
the agreement of F and G over specific viewing angles. One could
alter the calculation and determine the resolution in cones. As
adapted from earlier concepts applied in tomography [16, 17], we
previously defined the conical measure of FSC, the 3D FSC [6], as:
FSC δθ k
!
¼
P
k
!0
ffik, b k
0
∙ b k
! cos δθ
F k
! 0
G
∗
k
! 0
F δθ
j j
2 k
! 0
Here, the FSC is taken over all values of k
0 that are on the same
shell as k, and sufficiently close to the direction governed by the
parameter δθ, which is the half-angle of the cone. The half-angle is
defaulted to 20
, but can be varied by the user. A set of 1D FSC
Local and Directional Resolution in Cryo-EM Maps
163