

on “Navigator” in the main menu and go to “Acquire at points”,
where data collection can be started. Usually, we select “Rough
eucentricity”, “Autofocus”, and “Autocenter beam” for batch collection. To calculate the exposure time, we use the following
equation:
Exposure time s
ð Þ ¼ Total Dose e
À
=Å
2
 Pixel size Å
À Á
À
Á 2
h
i
= Dose measured e
À
=pix=s
ð
Þ Â Number of images in the tilt À series
ð
Þ
½
where
Total dose is the total dose desired, usually between 100 and
200 e
À /Å
2 .
Pixel size depends on the magnification used to collect data.
Dose measured is the number of electrons (e
À /pix/s) passing
through the hole. For K3 cameras, this can be up to 30 e
À /pix/s on
the sample area.
Number of tilt images in the tilt-series depends on the maximum
and minimum tilt angles and the angular increment (e.g., a tiltseries from À50
to +50
with 1
step will have 101 images).
3.2 Rapid Tilt-Series
Acquisition
Two rapid tilt-series methods are currently being developed on a
Titan Krios (Thermo Fisher Scientific) equipped with a single-axis
holder: continuous-tilting and fast-incremental [31]. In
continuous-tilting, the camera continuously records frames as the
sample is tilted. For this reason, only unidirectional and bidirectional tilt-schemes are possible. In fast-incremental, even though
the camera also records continuously, the beam shutter is used to
rapidly expose the target at discrete tilt angles, resulting in blank
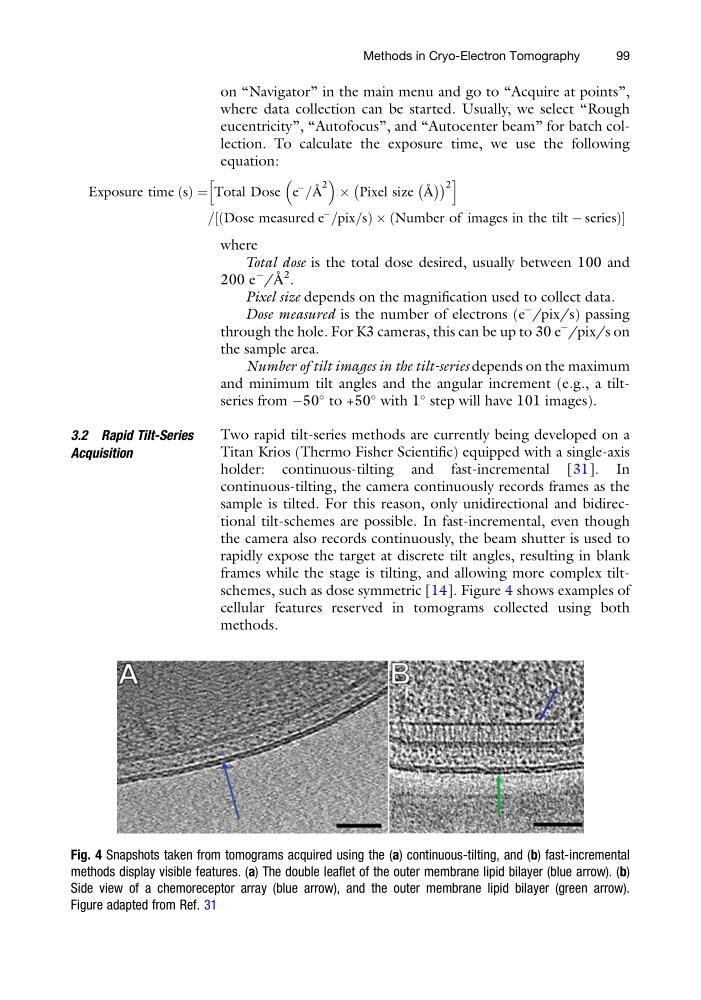
frames while the stage is tilting, and allowing more complex tiltschemes, such as dose symmetric [14]. Figure 4 shows examples of
cellular features reserved in tomograms collected using both
methods.
Fig. 4 Snapshots taken from tomograms acquired using the (a) continuous-tilting, and (b) fast-incremental
methods display visible features. (a) The double leaflet of the outer membrane lipid bilayer (blue arrow). (b)
Side view of a chemoreceptor array (blue arrow), and the outer membrane lipid bilayer (green arrow).
Figure adapted from Ref. 31
Methods in Cryo-Electron Tomography
99
where data collection can be started. Usually, we select “Rough
eucentricity”, “Autofocus”, and “Autocenter beam” for batch collection. To calculate the exposure time, we use the following
equation:
Exposure time s
ð Þ ¼ Total Dose e
À
=Å
2
 Pixel size Å
À Á
À
Á 2
h
i
= Dose measured e
À
=pix=s
ð
Þ Â Number of images in the tilt À series
ð
Þ
½
where
Total dose is the total dose desired, usually between 100 and
200 e
À /Å
2 .
Pixel size depends on the magnification used to collect data.
Dose measured is the number of electrons (e
À /pix/s) passing
through the hole. For K3 cameras, this can be up to 30 e
À /pix/s on
the sample area.
Number of tilt images in the tilt-series depends on the maximum
and minimum tilt angles and the angular increment (e.g., a tiltseries from À50
to +50
with 1
step will have 101 images).
3.2 Rapid Tilt-Series
Acquisition
Two rapid tilt-series methods are currently being developed on a
Titan Krios (Thermo Fisher Scientific) equipped with a single-axis
holder: continuous-tilting and fast-incremental [31]. In
continuous-tilting, the camera continuously records frames as the
sample is tilted. For this reason, only unidirectional and bidirectional tilt-schemes are possible. In fast-incremental, even though
the camera also records continuously, the beam shutter is used to
rapidly expose the target at discrete tilt angles, resulting in blank
frames while the stage is tilting, and allowing more complex tiltschemes, such as dose symmetric [14]. Figure 4 shows examples of
cellular features reserved in tomograms collected using both
methods.
Fig. 4 Snapshots taken from tomograms acquired using the (a) continuous-tilting, and (b) fast-incremental
methods display visible features. (a) The double leaflet of the outer membrane lipid bilayer (blue arrow). (b)
Side view of a chemoreceptor array (blue arrow), and the outer membrane lipid bilayer (green arrow).
Figure adapted from Ref. 31
Methods in Cryo-Electron Tomography
99