

8.1 Introduction
Queensland is the north-eastern Australian state, covering nearly 1.8 million square
kilometres (Queensland Government 2017a), nearly one-quarter of the total land
area of the Australian continent and making it the second largest state. The present
population is 4.925 million (Queensland Government 2017b) which is expected to
increase to between 8.01 and 11.275 million by 2061 (Queensland Government
2015). Agricultural businesses operated across just over half (51%) of Australia’s
total land area during 2016–2017. On 30 June 2017, there were 394 million hectares
of agricultural land in Australia, a six (6) percent increase on the previous year.
Queensland’s agricultural industries are comprised of:
• Plant industries, including field crops (sugarcane, cotton, grains and pulses),
production horticulture (nuts, fruit and vegetables), lifestyle horticulture (turf,
flowers, nursery and landscaping) and forestry
• Animal industries, including livestock and livestock products (including cattle,
sheep and pigs, poultry, kangaroos and fish/aquaculture) and livestock products,
such as wool, dairy, bees/honey and eggs
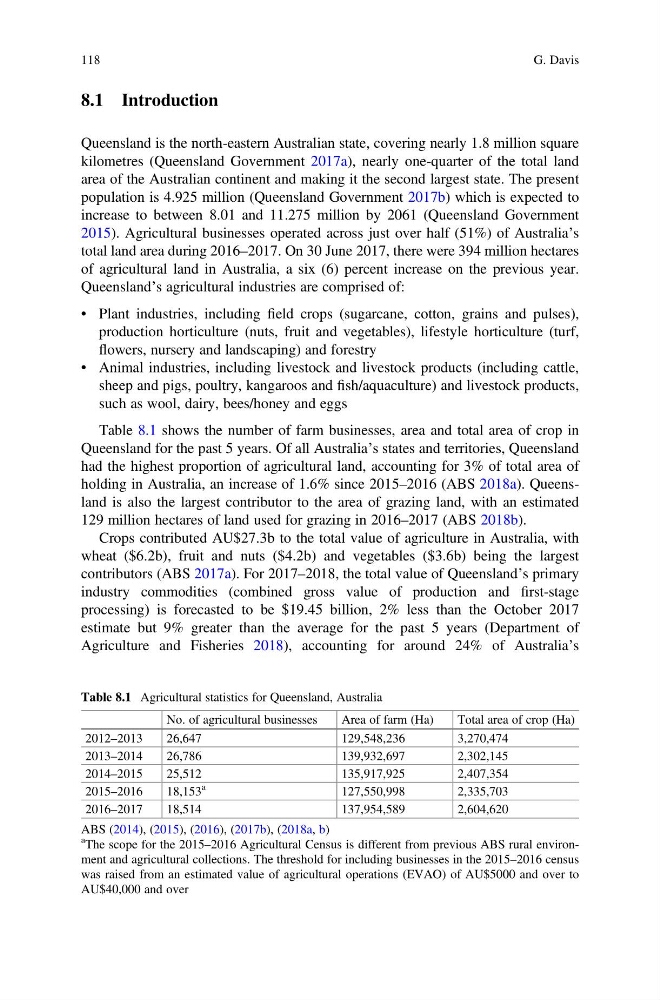
Table 8.1 shows the number of farm businesses, area and total area of crop in
Queensland for the past 5 years. Of all Australia’s states and territories, Queensland
had the highest proportion of agricultural land, accounting for 3% of total area of
holding in Australia, an increase of 1.6% since 2015–2016 (ABS 2018a). Queensland is also the largest contributor to the area of grazing land, with an estimated
129 million hectares of land used for grazing in 2016–2017 (ABS 2018b).
Crops contributed AU$27.3b to the total value of agriculture in Australia, with
wheat ($6.2b), fruit and nuts ($4.2b) and vegetables ($3.6b) being the largest
contributors (ABS 2017a). For 2017–2018, the total value of Queensland’s primary
industry commodities (combined gross value of production and first-stage
processing) is forecasted to be $19.45 billion, 2% less than the October 2017
estimate but 9% greater than the average for the past 5 years (Department of
Agriculture and Fisheries 2018), accounting for around 24% of Australia’s
Table 8.1 Agricultural statistics for Queensland, Australia
No. of agricultural businesses
Area of farm (Ha)
Total area of crop (Ha)
2012–2013
26,647
129,548,236
3,270,474
2013–2014
26,786
139,932,697
2,302,145
2014–2015
25,512
135,917,925
2,407,354
2015–2016
18,153
a
127,550,998
2,335,703
2016–2017
18,514
137,954,589
2,604,620
ABS (2014), (2015), (2016), (2017b), (2018a, b)
a The scope for the 2015–2016 Agricultural Census is different from previous ABS rural environment and agricultural collections. The threshold for including businesses in the 2015–2016 census
was raised from an estimated value of agricultural operations (EVAO) of AU$5000 and over to
AU$40,000 and over
118
G. Davis
Queensland is the north-eastern Australian state, covering nearly 1.8 million square
kilometres (Queensland Government 2017a), nearly one-quarter of the total land
area of the Australian continent and making it the second largest state. The present
population is 4.925 million (Queensland Government 2017b) which is expected to
increase to between 8.01 and 11.275 million by 2061 (Queensland Government
2015). Agricultural businesses operated across just over half (51%) of Australia’s
total land area during 2016–2017. On 30 June 2017, there were 394 million hectares
of agricultural land in Australia, a six (6) percent increase on the previous year.
Queensland’s agricultural industries are comprised of:
• Plant industries, including field crops (sugarcane, cotton, grains and pulses),
production horticulture (nuts, fruit and vegetables), lifestyle horticulture (turf,
flowers, nursery and landscaping) and forestry
• Animal industries, including livestock and livestock products (including cattle,
sheep and pigs, poultry, kangaroos and fish/aquaculture) and livestock products,
such as wool, dairy, bees/honey and eggs
Table 8.1 shows the number of farm businesses, area and total area of crop in
Queensland for the past 5 years. Of all Australia’s states and territories, Queensland
had the highest proportion of agricultural land, accounting for 3% of total area of
holding in Australia, an increase of 1.6% since 2015–2016 (ABS 2018a). Queensland is also the largest contributor to the area of grazing land, with an estimated
129 million hectares of land used for grazing in 2016–2017 (ABS 2018b).
Crops contributed AU$27.3b to the total value of agriculture in Australia, with
wheat ($6.2b), fruit and nuts ($4.2b) and vegetables ($3.6b) being the largest
contributors (ABS 2017a). For 2017–2018, the total value of Queensland’s primary
industry commodities (combined gross value of production and first-stage
processing) is forecasted to be $19.45 billion, 2% less than the October 2017
estimate but 9% greater than the average for the past 5 years (Department of
Agriculture and Fisheries 2018), accounting for around 24% of Australia’s
Table 8.1 Agricultural statistics for Queensland, Australia
No. of agricultural businesses
Area of farm (Ha)
Total area of crop (Ha)
2012–2013
26,647
129,548,236
3,270,474
2013–2014
26,786
139,932,697
2,302,145
2014–2015
25,512
135,917,925
2,407,354
2015–2016
18,153
a
127,550,998
2,335,703
2016–2017
18,514
137,954,589
2,604,620
ABS (2014), (2015), (2016), (2017b), (2018a, b)
a The scope for the 2015–2016 Agricultural Census is different from previous ABS rural environment and agricultural collections. The threshold for including businesses in the 2015–2016 census
was raised from an estimated value of agricultural operations (EVAO) of AU$5000 and over to
AU$40,000 and over
118
G. Davis