

k si being the degree of node i computed with respect only of
nodes pertaining to the same cluster s and k i the node i degree.
High P nodes, thus, have strong connections with nodes pertaining
to other clusters, so they are likely to play a key role in signal
transmission between the two clusters (domains in PCNs).
(b) the intramodule connectivity z-score z defined for the node
i in the cluster s as:
z ¼
k i À k s
σ s
ð8Þ
k s and σ s being the average and the standard deviation of
intramodule degree in cluster s. High z nodes are responsible for
the cluster stability, but are not likely to participate in communication between clusters.
The clustering profile of networks is aptly represented by means
of P-z maps: in general, once the protein contact network is built, it
is possible to use web resources to perform clustering and represent
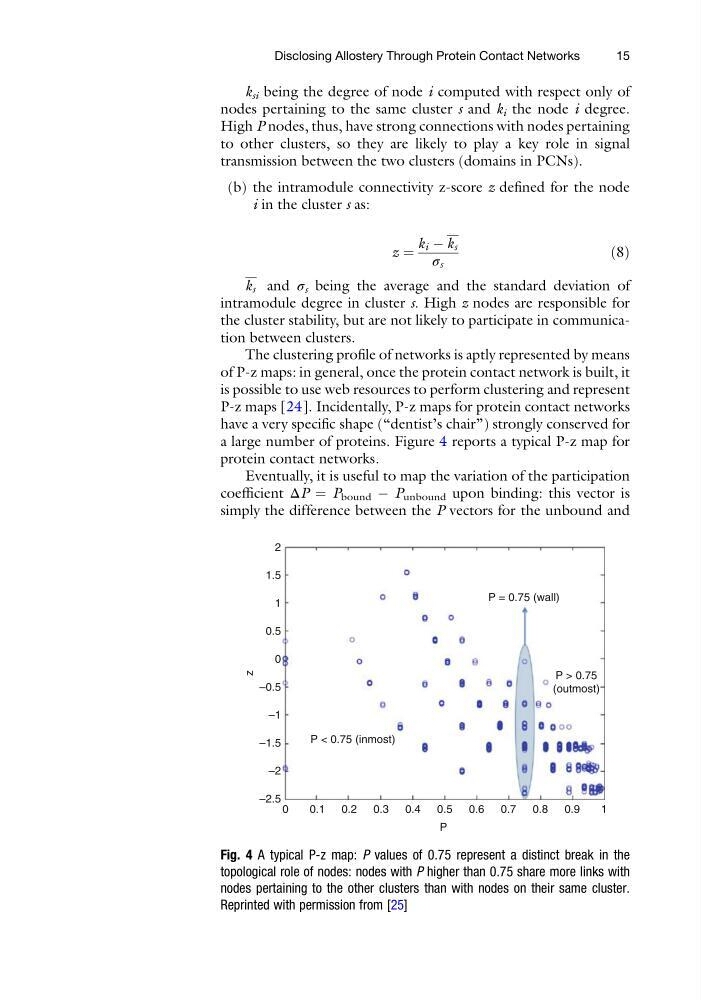
P-z maps [24]. Incidentally, P-z maps for protein contact networks
have a very specific shape (“dentist’s chair”) strongly conserved for
a large number of proteins. Figure 4 reports a typical P-z map for
protein contact networks.
Eventually, it is useful to map the variation of the participation
coefficient ΔP ¼ P bound À P unbound upon binding: this vector is
simply the difference between the P vectors for the unbound and
0
0.1 0.2
P < 0.75 (inmost)
P > 0.75
(outmost)
P = 0.75 (wall)
0.3 0.4 0.5
P
z
0.6 0.7 0.8 0.9
1
–2.5
–2
–1.5
–1
–0.5
0
0.5
1
1.5
2
Fig. 4 A typical P-z map: P values of 0.75 represent a distinct break in the
topological role of nodes: nodes with P higher than 0.75 share more links with
nodes pertaining to the other clusters than with nodes on their same cluster.
Reprinted with permission from [25]
Disclosing Allostery Through Protein Contact Networks
15
nodes pertaining to the same cluster s and k i the node i degree.
High P nodes, thus, have strong connections with nodes pertaining
to other clusters, so they are likely to play a key role in signal
transmission between the two clusters (domains in PCNs).
(b) the intramodule connectivity z-score z defined for the node
i in the cluster s as:
z ¼
k i À k s
σ s
ð8Þ
k s and σ s being the average and the standard deviation of
intramodule degree in cluster s. High z nodes are responsible for
the cluster stability, but are not likely to participate in communication between clusters.
The clustering profile of networks is aptly represented by means
of P-z maps: in general, once the protein contact network is built, it
is possible to use web resources to perform clustering and represent
P-z maps [24]. Incidentally, P-z maps for protein contact networks
have a very specific shape (“dentist’s chair”) strongly conserved for
a large number of proteins. Figure 4 reports a typical P-z map for
protein contact networks.
Eventually, it is useful to map the variation of the participation
coefficient ΔP ¼ P bound À P unbound upon binding: this vector is
simply the difference between the P vectors for the unbound and
0
0.1 0.2
P < 0.75 (inmost)
P > 0.75
(outmost)
P = 0.75 (wall)
0.3 0.4 0.5
P
z
0.6 0.7 0.8 0.9
1
–2.5
–2
–1.5
–1
–0.5
0
0.5
1
1.5
2
Fig. 4 A typical P-z map: P values of 0.75 represent a distinct break in the
topological role of nodes: nodes with P higher than 0.75 share more links with
nodes pertaining to the other clusters than with nodes on their same cluster.
Reprinted with permission from [25]
Disclosing Allostery Through Protein Contact Networks
15