

member number <10 and edges with betweenness <1000
were not considered.
6. The length of a path between two distant nodes is the sum of
the edges weights between consecutive nodes along the path.
The shortest path is obtained by optimization of this length.
7. Suboptimal paths are determined in addition to the shortest
path to measure the path degeneracy of the network.
8. The network, community, and optimal/sub-optimal paths
analysis of Fab/peptide systems were performed by using NetworkView [30] module in VMD.
100
200
Residue Number
Residue Number
300
400
–0.9000
–1.000
–0.8000
–0.7000
–0.6000
–0.5000
–0.4000
–0.3000
–0.2000
–0.1000
0.2000
0.1000
0.3000
0.4000
0.5000
0.6000
0.7000
0.8000
0.9000
1.000
0
100
200
300
400
VL
CL
VH
CH1
VL
CL
VH
CH1
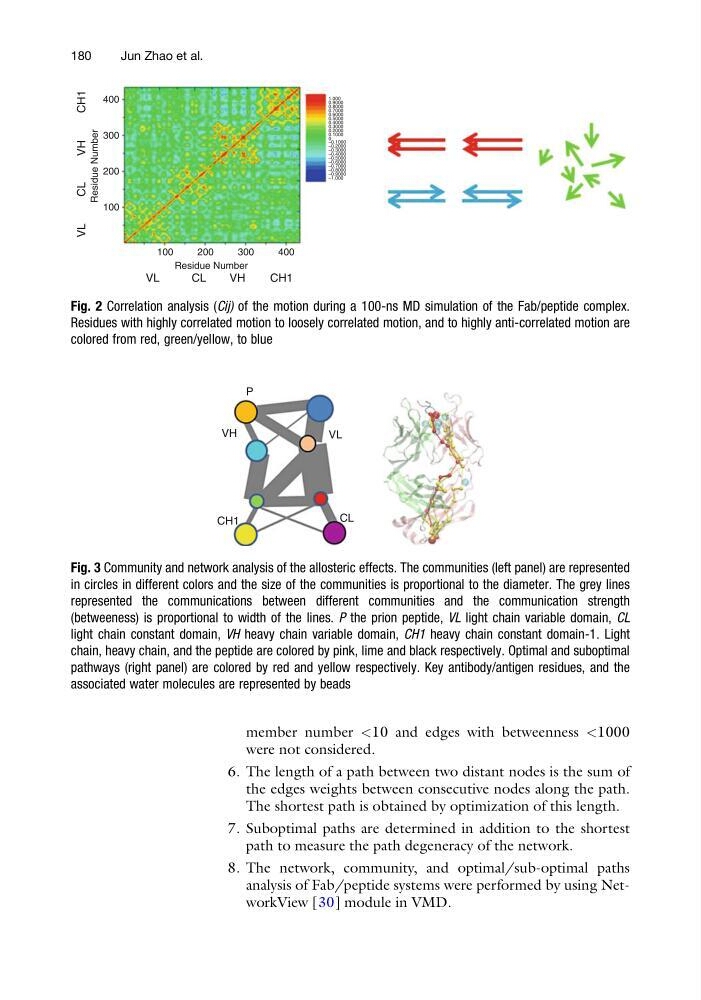
Fig. 2 Correlation analysis (Cij) of the motion during a 100-ns MD simulation of the Fab/peptide complex.
Residues with highly correlated motion to loosely correlated motion, and to highly anti-correlated motion are
colored from red, green/yellow, to blue
VH
CH1
VL
P
CL
Fig. 3 Community and network analysis of the allosteric effects. The communities (left panel) are represented
in circles in different colors and the size of the communities is proportional to the diameter. The grey lines
represented the communications between different communities and the communication strength
(betweeness) is proportional to width of the lines. P the prion peptide, VL light chain variable domain, CL
light chain constant domain, VH heavy chain variable domain, CH1 heavy chain constant domain-1. Light
chain, heavy chain, and the peptide are colored by pink, lime and black respectively. Optimal and suboptimal
pathways (right panel) are colored by red and yellow respectively. Key antibody/antigen residues, and the
associated water molecules are represented by beads
180
Jun Zhao et al.
were not considered.
6. The length of a path between two distant nodes is the sum of
the edges weights between consecutive nodes along the path.
The shortest path is obtained by optimization of this length.
7. Suboptimal paths are determined in addition to the shortest
path to measure the path degeneracy of the network.
8. The network, community, and optimal/sub-optimal paths
analysis of Fab/peptide systems were performed by using NetworkView [30] module in VMD.
100
200
Residue Number
Residue Number
300
400
–0.9000
–1.000
–0.8000
–0.7000
–0.6000
–0.5000
–0.4000
–0.3000
–0.2000
–0.1000
0.2000
0.1000
0.3000
0.4000
0.5000
0.6000
0.7000
0.8000
0.9000
1.000
0
100
200
300
400
VL
CL
VH
CH1
VL
CL
VH
CH1
Fig. 2 Correlation analysis (Cij) of the motion during a 100-ns MD simulation of the Fab/peptide complex.
Residues with highly correlated motion to loosely correlated motion, and to highly anti-correlated motion are
colored from red, green/yellow, to blue
VH
CH1
VL
P
CL
Fig. 3 Community and network analysis of the allosteric effects. The communities (left panel) are represented
in circles in different colors and the size of the communities is proportional to the diameter. The grey lines
represented the communications between different communities and the communication strength
(betweeness) is proportional to width of the lines. P the prion peptide, VL light chain variable domain, CL
light chain constant domain, VH heavy chain variable domain, CH1 heavy chain constant domain-1. Light
chain, heavy chain, and the peptide are colored by pink, lime and black respectively. Optimal and suboptimal
pathways (right panel) are colored by red and yellow respectively. Key antibody/antigen residues, and the
associated water molecules are represented by beads
180
Jun Zhao et al.