

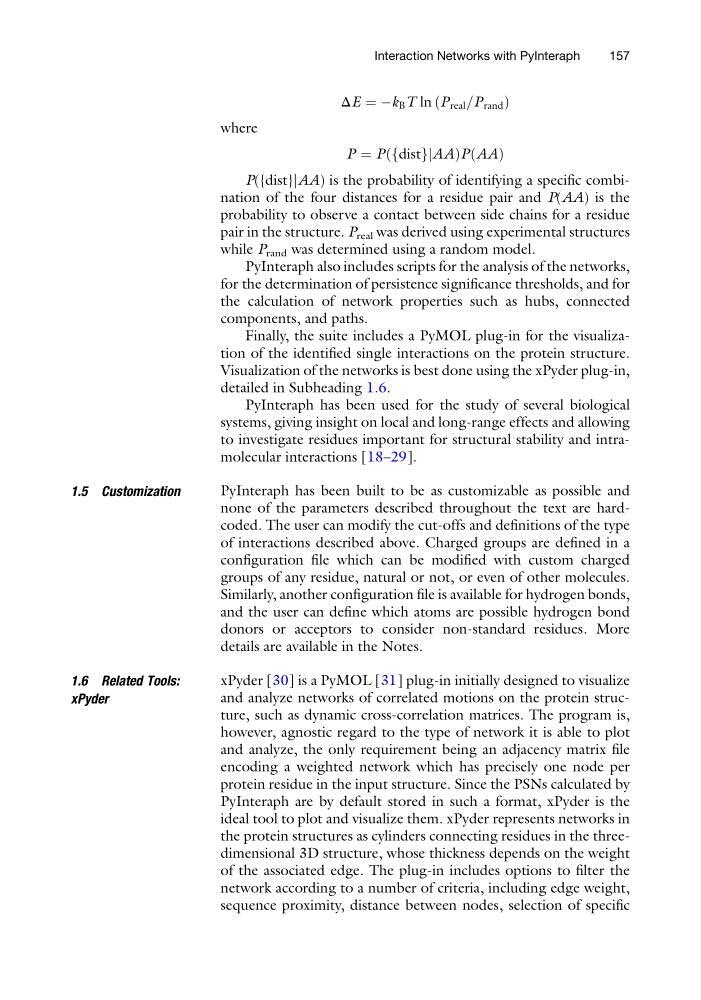
ΔE ¼ Àk B T ln P real =P rand
ð
Þ
where
P ¼ P dist
f
gjAA
ð
Þ P AA
ð
Þ
P({dist}|AA) is the probability of identifying a specific combination of the four distances for a residue pair and P(AA) is the
probability to observe a contact between side chains for a residue
pair in the structure. P real was derived using experimental structures
while P rand was determined using a random model.
PyInteraph also includes scripts for the analysis of the networks,
for the determination of persistence significance thresholds, and for
the calculation of network properties such as hubs, connected
components, and paths.
Finally, the suite includes a PyMOL plug-in for the visualization of the identified single interactions on the protein structure.
Visualization of the networks is best done using the xPyder plug-in,
detailed in Subheading 1.6.
PyInteraph has been used for the study of several biological
systems, giving insight on local and long-range effects and allowing
to investigate residues important for structural stability and intramolecular interactions [18–29].
1.5 Customization
PyInteraph has been built to be as customizable as possible and
none of the parameters described throughout the text are hardcoded. The user can modify the cut-offs and definitions of the type
of interactions described above. Charged groups are defined in a
configuration file which can be modified with custom charged
groups of any residue, natural or not, or even of other molecules.
Similarly, another configuration file is available for hydrogen bonds,
and the user can define which atoms are possible hydrogen bond
donors or acceptors to consider non-standard residues. More
details are available in the Notes.
1.6 Related Tools:
xPyder
xPyder [30] is a PyMOL [31] plug-in initially designed to visualize
and analyze networks of correlated motions on the protein structure, such as dynamic cross-correlation matrices. The program is,
however, agnostic regard to the type of network it is able to plot
and analyze, the only requirement being an adjacency matrix file
encoding a weighted network which has precisely one node per
protein residue in the input structure. Since the PSNs calculated by
PyInteraph are by default stored in such a format, xPyder is the
ideal tool to plot and visualize them. xPyder represents networks in
the protein structures as cylinders connecting residues in the threedimensional 3D structure, whose thickness depends on the weight
of the associated edge. The plug-in includes options to filter the
network according to a number of criteria, including edge weight,
sequence proximity, distance between nodes, selection of specific
Interaction Networks with PyInteraph
157
ð
Þ
where
P ¼ P dist
f
gjAA
ð
Þ P AA
ð
Þ
P({dist}|AA) is the probability of identifying a specific combination of the four distances for a residue pair and P(AA) is the
probability to observe a contact between side chains for a residue
pair in the structure. P real was derived using experimental structures
while P rand was determined using a random model.
PyInteraph also includes scripts for the analysis of the networks,
for the determination of persistence significance thresholds, and for
the calculation of network properties such as hubs, connected
components, and paths.
Finally, the suite includes a PyMOL plug-in for the visualization of the identified single interactions on the protein structure.
Visualization of the networks is best done using the xPyder plug-in,
detailed in Subheading 1.6.
PyInteraph has been used for the study of several biological
systems, giving insight on local and long-range effects and allowing
to investigate residues important for structural stability and intramolecular interactions [18–29].
1.5 Customization
PyInteraph has been built to be as customizable as possible and
none of the parameters described throughout the text are hardcoded. The user can modify the cut-offs and definitions of the type
of interactions described above. Charged groups are defined in a
configuration file which can be modified with custom charged
groups of any residue, natural or not, or even of other molecules.
Similarly, another configuration file is available for hydrogen bonds,
and the user can define which atoms are possible hydrogen bond
donors or acceptors to consider non-standard residues. More
details are available in the Notes.
1.6 Related Tools:
xPyder
xPyder [30] is a PyMOL [31] plug-in initially designed to visualize
and analyze networks of correlated motions on the protein structure, such as dynamic cross-correlation matrices. The program is,
however, agnostic regard to the type of network it is able to plot
and analyze, the only requirement being an adjacency matrix file
encoding a weighted network which has precisely one node per
protein residue in the input structure. Since the PSNs calculated by
PyInteraph are by default stored in such a format, xPyder is the
ideal tool to plot and visualize them. xPyder represents networks in
the protein structures as cylinders connecting residues in the threedimensional 3D structure, whose thickness depends on the weight
of the associated edge. The plug-in includes options to filter the
network according to a number of criteria, including edge weight,
sequence proximity, distance between nodes, selection of specific
Interaction Networks with PyInteraph
157