

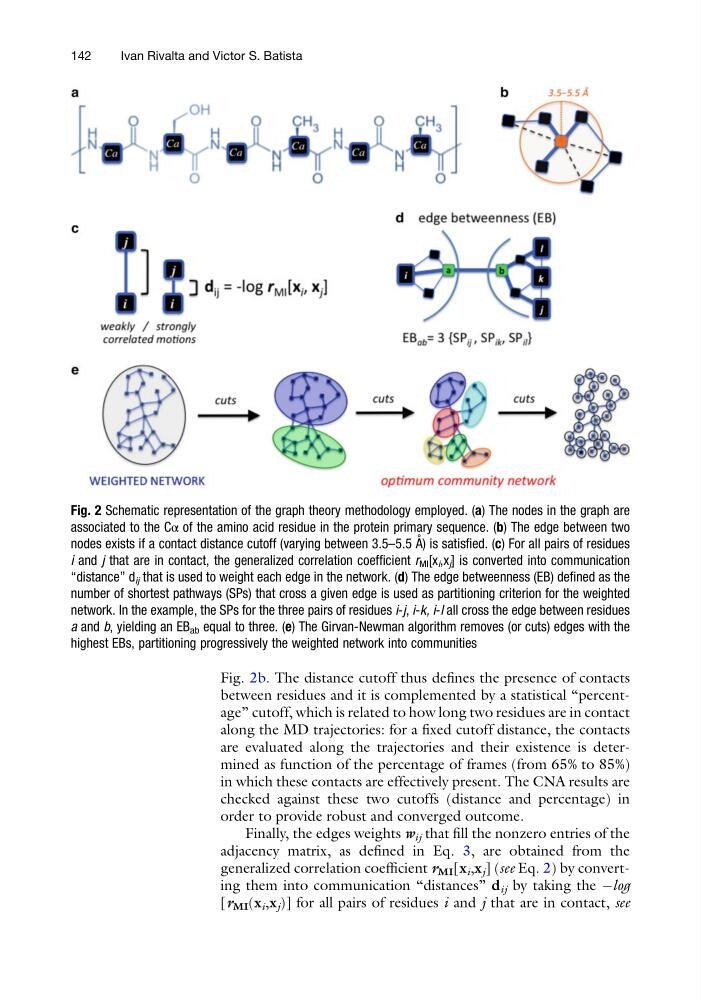
Fig. 2b. The distance cutoff thus defines the presence of contacts
between residues and it is complemented by a statistical “percentage” cutoff, which is related to how long two residues are in contact
along the MD trajectories: for a fixed cutoff distance, the contacts
are evaluated along the trajectories and their existence is determined as function of the percentage of frames (from 65% to 85%)
in which these contacts are effectively present. The CNA results are
checked against these two cutoffs (distance and percentage) in
order to provide robust and converged outcome.
Finally, the edges weights w ij that fill the nonzero entries of the
adjacency matrix, as defined in Eq. 3, are obtained from the
generalized correlation coefficient r MI [x i ,x j ] (see Eq. 2) by converting them into communication “distances” d ij by taking the Àlog
[r MI (x i ,x j )] for all pairs of residues i and j that are in contact, see
Fig. 2 Schematic representation of the graph theory methodology employed. (a) The nodes in the graph are
associated to the Cα of the amino acid residue in the protein primary sequence. (b) The edge between two
nodes exists if a contact distance cutoff (varying between 3.5–5.5 A ˚ ) is satisfied. (c) For all pairs of residues
i and j that are in contact, the generalized correlation coefficient r MI [x i ,x j ] is converted into communication
“distance” d ij that is used to weight each edge in the network. (d) The edge betweenness (EB) defined as the
number of shortest pathways (SPs) that cross a given edge is used as partitioning criterion for the weighted
network. In the example, the SPs for the three pairs of residues i-j, i-k, i-l all cross the edge between residues
a and b, yielding an EB ab equal to three. (e) The Girvan-Newman algorithm removes (or cuts) edges with the
highest EBs, partitioning progressively the weighted network into communities
142
Ivan Rivalta and Victor S. Batista
between residues and it is complemented by a statistical “percentage” cutoff, which is related to how long two residues are in contact
along the MD trajectories: for a fixed cutoff distance, the contacts
are evaluated along the trajectories and their existence is determined as function of the percentage of frames (from 65% to 85%)
in which these contacts are effectively present. The CNA results are
checked against these two cutoffs (distance and percentage) in
order to provide robust and converged outcome.
Finally, the edges weights w ij that fill the nonzero entries of the
adjacency matrix, as defined in Eq. 3, are obtained from the
generalized correlation coefficient r MI [x i ,x j ] (see Eq. 2) by converting them into communication “distances” d ij by taking the Àlog
[r MI (x i ,x j )] for all pairs of residues i and j that are in contact, see
Fig. 2 Schematic representation of the graph theory methodology employed. (a) The nodes in the graph are
associated to the Cα of the amino acid residue in the protein primary sequence. (b) The edge between two
nodes exists if a contact distance cutoff (varying between 3.5–5.5 A ˚ ) is satisfied. (c) For all pairs of residues
i and j that are in contact, the generalized correlation coefficient r MI [x i ,x j ] is converted into communication
“distance” d ij that is used to weight each edge in the network. (d) The edge betweenness (EB) defined as the
number of shortest pathways (SPs) that cross a given edge is used as partitioning criterion for the weighted
network. In the example, the SPs for the three pairs of residues i-j, i-k, i-l all cross the edge between residues
a and b, yielding an EB ab equal to three. (e) The Girvan-Newman algorithm removes (or cuts) edges with the
highest EBs, partitioning progressively the weighted network into communities
142
Ivan Rivalta and Victor S. Batista