

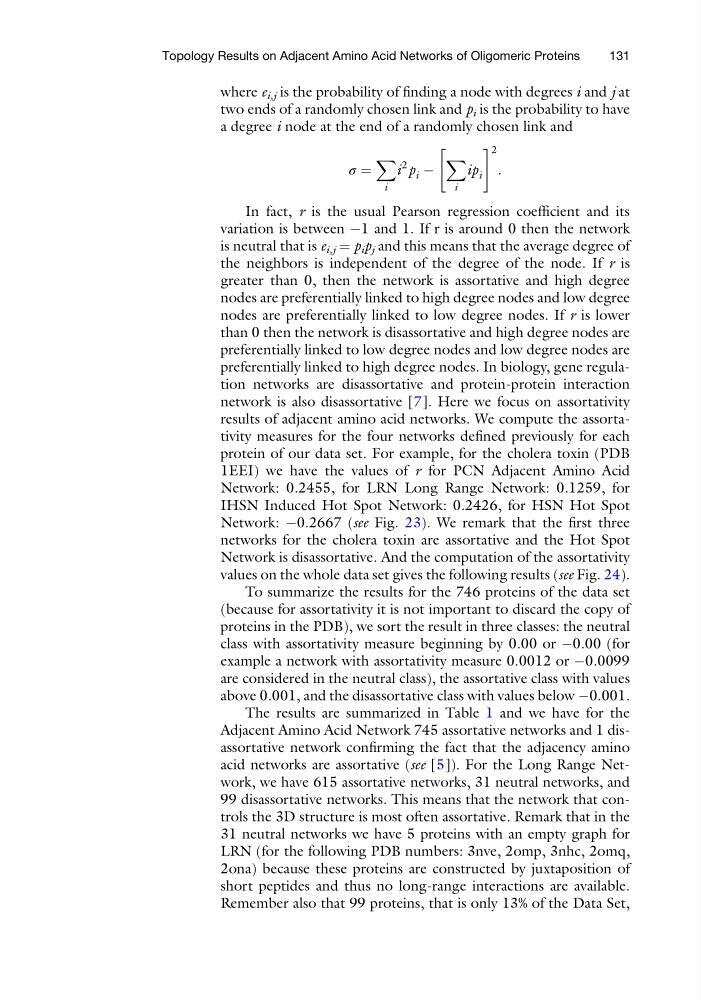
where e i,j is the probability of finding a node with degrees i and j at
two ends of a randomly chosen link and p i is the probability to have
a degree i node at the end of a randomly chosen link and
σ ¼
X
i
i
2
p i À
X
i
ip i
"
# 2
:
In fact, r is the usual Pearson regression coefficient and its
variation is between À1 and 1. If r is around 0 then the network
is neutral that is e i,j ¼ p i p j and this means that the average degree of
the neighbors is independent of the degree of the node. If r is
greater than 0, then the network is assortative and high degree
nodes are preferentially linked to high degree nodes and low degree
nodes are preferentially linked to low degree nodes. If r is lower
than 0 then the network is disassortative and high degree nodes are
preferentially linked to low degree nodes and low degree nodes are
preferentially linked to high degree nodes. In biology, gene regulation networks are disassortative and protein-protein interaction
network is also disassortative [7]. Here we focus on assortativity
results of adjacent amino acid networks. We compute the assortativity measures for the four networks defined previously for each
protein of our data set. For example, for the cholera toxin (PDB
1EEI) we have the values of r for PCN Adjacent Amino Acid
Network: 0.2455, for LRN Long Range Network: 0.1259, for
IHSN Induced Hot Spot Network: 0.2426, for HSN Hot Spot
Network: À0.2667 (see Fig. 23). We remark that the first three
networks for the cholera toxin are assortative and the Hot Spot
Network is disassortative. And the computation of the assortativity
values on the whole data set gives the following results (see Fig. 24).
To summarize the results for the 746 proteins of the data set
(because for assortativity it is not important to discard the copy of
proteins in the PDB), we sort the result in three classes: the neutral
class with assortativity measure beginning by 0.00 or À0.00 (for
example a network with assortativity measure 0.0012 or À0.0099
are considered in the neutral class), the assortative class with values
above 0.001, and the disassortative class with values below À0.001.
The results are summarized in Table 1 and we have for the
Adjacent Amino Acid Network 745 assortative networks and 1 disassortative network confirming the fact that the adjacency amino
acid networks are assortative (see [5]). For the Long Range Network, we have 615 assortative networks, 31 neutral networks, and
99 disassortative networks. This means that the network that controls the 3D structure is most often assortative. Remark that in the
31 neutral networks we have 5 proteins with an empty graph for
LRN (for the following PDB numbers: 3nve, 2omp, 3nhc, 2omq,
2ona) because these proteins are constructed by juxtaposition of
short peptides and thus no long-range interactions are available.
Remember also that 99 proteins, that is only 13% of the Data Set,
Topology Results on Adjacent Amino Acid Networks of Oligomeric Proteins
131
two ends of a randomly chosen link and p i is the probability to have
a degree i node at the end of a randomly chosen link and
σ ¼
X
i
i
2
p i À
X
i
ip i
"
# 2
:
In fact, r is the usual Pearson regression coefficient and its
variation is between À1 and 1. If r is around 0 then the network
is neutral that is e i,j ¼ p i p j and this means that the average degree of
the neighbors is independent of the degree of the node. If r is
greater than 0, then the network is assortative and high degree
nodes are preferentially linked to high degree nodes and low degree
nodes are preferentially linked to low degree nodes. If r is lower
than 0 then the network is disassortative and high degree nodes are
preferentially linked to low degree nodes and low degree nodes are
preferentially linked to high degree nodes. In biology, gene regulation networks are disassortative and protein-protein interaction
network is also disassortative [7]. Here we focus on assortativity
results of adjacent amino acid networks. We compute the assortativity measures for the four networks defined previously for each
protein of our data set. For example, for the cholera toxin (PDB
1EEI) we have the values of r for PCN Adjacent Amino Acid
Network: 0.2455, for LRN Long Range Network: 0.1259, for
IHSN Induced Hot Spot Network: 0.2426, for HSN Hot Spot
Network: À0.2667 (see Fig. 23). We remark that the first three
networks for the cholera toxin are assortative and the Hot Spot
Network is disassortative. And the computation of the assortativity
values on the whole data set gives the following results (see Fig. 24).
To summarize the results for the 746 proteins of the data set
(because for assortativity it is not important to discard the copy of
proteins in the PDB), we sort the result in three classes: the neutral
class with assortativity measure beginning by 0.00 or À0.00 (for
example a network with assortativity measure 0.0012 or À0.0099
are considered in the neutral class), the assortative class with values
above 0.001, and the disassortative class with values below À0.001.
The results are summarized in Table 1 and we have for the
Adjacent Amino Acid Network 745 assortative networks and 1 disassortative network confirming the fact that the adjacency amino
acid networks are assortative (see [5]). For the Long Range Network, we have 615 assortative networks, 31 neutral networks, and
99 disassortative networks. This means that the network that controls the 3D structure is most often assortative. Remark that in the
31 neutral networks we have 5 proteins with an empty graph for
LRN (for the following PDB numbers: 3nve, 2omp, 3nhc, 2omq,
2ona) because these proteins are constructed by juxtaposition of
short peptides and thus no long-range interactions are available.
Remember also that 99 proteins, that is only 13% of the Data Set,
Topology Results on Adjacent Amino Acid Networks of Oligomeric Proteins
131