

1. PDB coordinates
2. Cleaned PDB file
3. IdenƟfy nodes &
edges; assign edge
weights
Fetch ATOM records
Remove Hydrogen atoms
Remove mulƟple occupancies
Calculate side-chain atom distances
4. Obtain weighted
adjacency matrix, A
Construct Protein Side-chain
Network (PSN)
5. Obtain Laplacian
matrix, L
Construct Laplacian matrix (L=D –A ;
where D is the degree matrix i.e.
matrix with diagonal elements equal
to sum of edge weights incident on
that node)
Spectral decomposiƟon
6. Obtain Eigen values
and Eigen vectors
Find 2 nd smallest Eigen value
and Eigen vector
7. Obtain Fiedler Vector
Sort nodes according to
Fiedler vector components
8. ParƟƟon nodes
according to the slope
9. Residue Clustering
Segregate nodes belonging to
each parƟƟon into
corresponding clusters
Example.pdb
Example_clean.pdb
0 0.4 0.5 0
0
0.4 0 0.1 0
0
0.5 0.1 0 0.3 0.2
0
0 0.3 0
0
0
0 0.2 0
0
A =
Weighted Adjacency matrix
0.9 − 0.4 − 0.5
0
0
− 0.4
0.5 − 0.1
0
0
− 0.5 − 0.1
1.1 − 0.3 − 0.2
0
0
−0 . 3
0 . 3
0
0
0
− 0.2
0
0.2
L =
Laplacian matrix (L =D - A)
2
1
3
4
5
0.5
0.3
0.2
0.1
0.4
IdenƟfy nodes (i.e. amino acids), edges (i.e.
spaƟal neighbors with atom contacts within
4.5Å) , assign edge weights (I ij = n ij / N ij )
L = QΛQ
Spectral decomposiƟon
Eigen values [
Eigen vectors 0.44 − .
0.27
0.52
− 0.62
0.44 − .
0.48 − 0.63
0.15
0.44 − .
− 0.04
0.49
0.73
0.44 − .
− 0.82 − 0.24
− 0.17
0.44
.
0.11 − 0.14
− 0.10
Fiedler Vector = Eigen vector corresponding to 2 nd lowest eigen value
ExtracƟng residue clusters using sorted Fiedler vector components in a PSN
Cluster 1
Cluster 2
Cluster 3
Cluster 4
Flowchart for spectral
analysis of Protein
Structure Networks (PSNs)
The doƩed line shows the slope of the sorted Fiedler vector based on which the
Fiedler vector is cut (shown in different colors). Nodes in same cluster have closer
Fiedler vector components.
PSN generated for Example.pdb
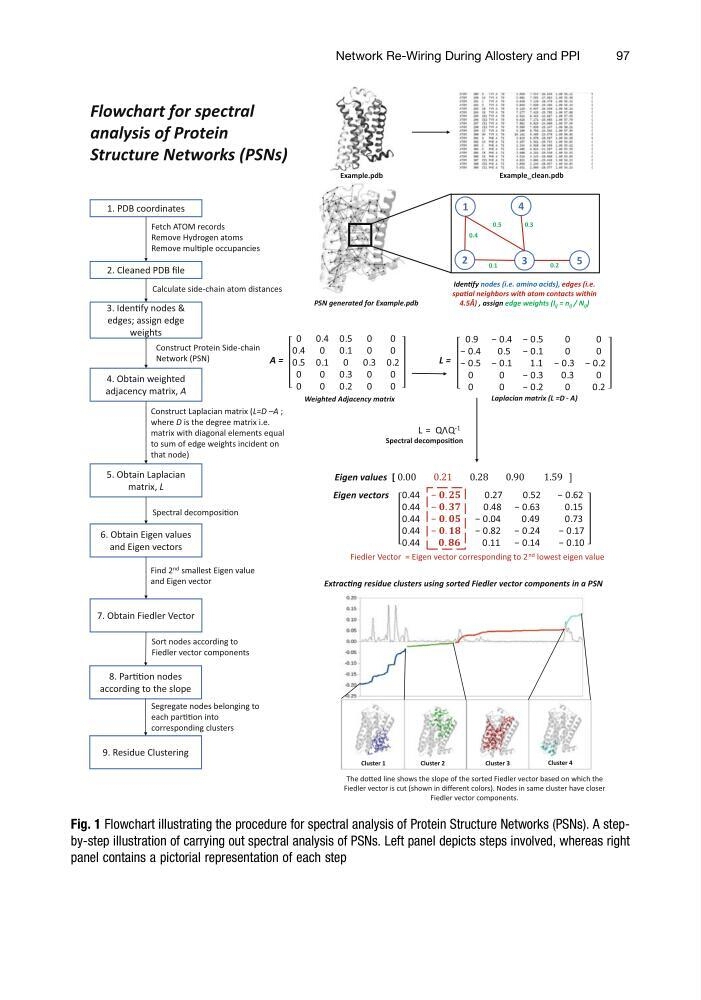
Fig. 1 Flowchart illustrating the procedure for spectral analysis of Protein Structure Networks (PSNs). A stepby-step illustration of carrying out spectral analysis of PSNs. Left panel depicts steps involved, whereas right
panel contains a pictorial representation of each step
Network Re-Wiring During Allostery and PPI
97
2. Cleaned PDB file
3. IdenƟfy nodes &
edges; assign edge
weights
Fetch ATOM records
Remove Hydrogen atoms
Remove mulƟple occupancies
Calculate side-chain atom distances
4. Obtain weighted
adjacency matrix, A
Construct Protein Side-chain
Network (PSN)
5. Obtain Laplacian
matrix, L
Construct Laplacian matrix (L=D –A ;
where D is the degree matrix i.e.
matrix with diagonal elements equal
to sum of edge weights incident on
that node)
Spectral decomposiƟon
6. Obtain Eigen values
and Eigen vectors
Find 2 nd smallest Eigen value
and Eigen vector
7. Obtain Fiedler Vector
Sort nodes according to
Fiedler vector components
8. ParƟƟon nodes
according to the slope
9. Residue Clustering
Segregate nodes belonging to
each parƟƟon into
corresponding clusters
Example.pdb
Example_clean.pdb
0 0.4 0.5 0
0
0.4 0 0.1 0
0
0.5 0.1 0 0.3 0.2
0
0 0.3 0
0
0
0 0.2 0
0
A =
Weighted Adjacency matrix
0.9 − 0.4 − 0.5
0
0
− 0.4
0.5 − 0.1
0
0
− 0.5 − 0.1
1.1 − 0.3 − 0.2
0
0
−0 . 3
0 . 3
0
0
0
− 0.2
0
0.2
L =
Laplacian matrix (L =D - A)
2
1
3
4
5
0.5
0.3
0.2
0.1
0.4
IdenƟfy nodes (i.e. amino acids), edges (i.e.
spaƟal neighbors with atom contacts within
4.5Å) , assign edge weights (I ij = n ij / N ij )
L = QΛQ
Spectral decomposiƟon
Eigen values [
Eigen vectors 0.44 − .
0.27
0.52
− 0.62
0.44 − .
0.48 − 0.63
0.15
0.44 − .
− 0.04
0.49
0.73
0.44 − .
− 0.82 − 0.24
− 0.17
0.44
.
0.11 − 0.14
− 0.10
Fiedler Vector = Eigen vector corresponding to 2 nd lowest eigen value
ExtracƟng residue clusters using sorted Fiedler vector components in a PSN
Cluster 1
Cluster 2
Cluster 3
Cluster 4
Flowchart for spectral
analysis of Protein
Structure Networks (PSNs)
The doƩed line shows the slope of the sorted Fiedler vector based on which the
Fiedler vector is cut (shown in different colors). Nodes in same cluster have closer
Fiedler vector components.
PSN generated for Example.pdb
Fig. 1 Flowchart illustrating the procedure for spectral analysis of Protein Structure Networks (PSNs). A stepby-step illustration of carrying out spectral analysis of PSNs. Left panel depicts steps involved, whereas right
panel contains a pictorial representation of each step
Network Re-Wiring During Allostery and PPI
97