

177
7
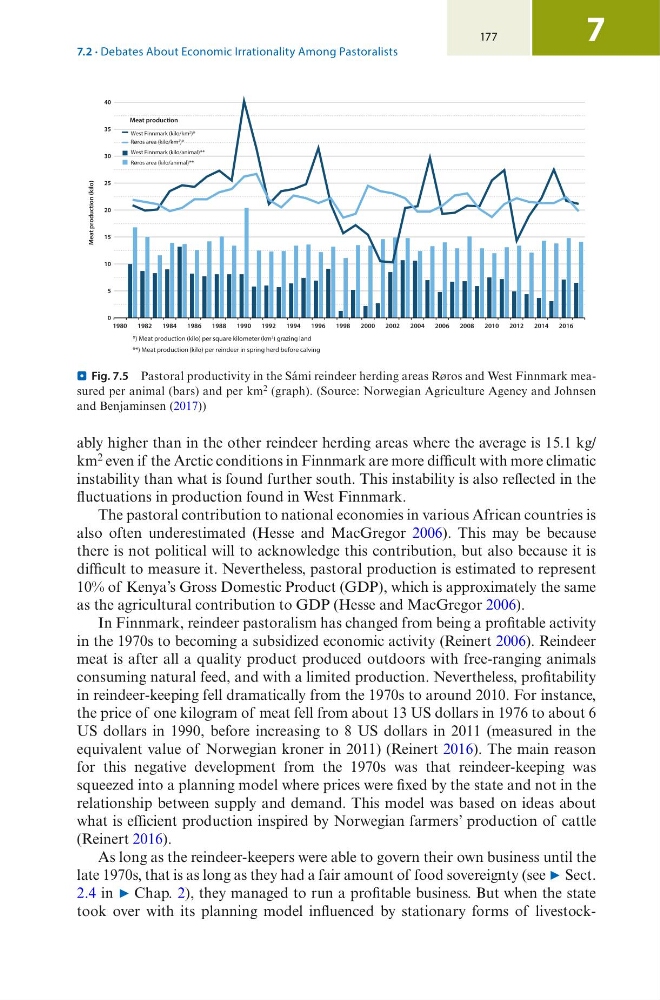
ably higher than in the other reindeer herding areas where the average is 15.1 kg/
km 2 even if the Arctic conditions in Finnmark are more difficult with more climatic
instability than what is found further south. This instability is also reflected in the
fluctuations in production found in West Finnmark.
The pastoral contribution to national economies in various African countries is
also often underestimated (Hesse and MacGregor 2006). This may be because
there is not political will to acknowledge this contribution, but also because it is
difficult to measure it. Nevertheless, pastoral production is estimated to represent
10% of Kenya’s Gross Domestic Product (GDP), which is approximately the same
as the agricultural contribution to GDP (Hesse and MacGregor 2006).
In Finnmark, reindeer pastoralism has changed from being a profitable activity
in the 1970s to becoming a subsidized economic activity (Reinert 2006). Reindeer
meat is after all a quality product produced outdoors with free-ranging animals
consuming natural feed, and with a limited production. Nevertheless, profitability
in reindeer-keeping fell dramatically from the 1970s to around 2010. For instance,
the price of one kilogram of meat fell from about 13 US dollars in 1976 to about 6
US dollars in 1990, before increasing to 8 US dollars in 2011 (measured in the
equivalent value of Norwegian kroner in 2011) (Reinert 2016). The main reason
for this negative development from the 1970s was that reindeer-keeping was
squeezed into a planning model where prices were fixed by the state and not in the
relationship between supply and demand. This model was based on ideas about
what is efficient production inspired by Norwegian farmers’ production of cattle
(Reinert 2016).
As long as the reindeer-keepers were able to govern their own business until the
late 1970s, that is as long as they had a fair amount of food sovereignty (see 7 Sect.
2.4 in 7 Chap. 2), they managed to run a profitable business. But when the state
took over with its planning model influenced by stationary forms of livestock0
5
10
15
20
25
30
35
40
1980
1982
1984
1986
1988
1990
1992
1994
1996
1998
2000
2002
2004
2006
2008
2010
2012
2014
2016
Meat production (kilo)
West Finnmark (kilo/animal)**
West Finnmark (kilo/km 2 )*
Meat production
**) Meat production (kilo) per reindeer in spring herd before calving
*) Meat production (kilo) per square kilometer (km 2 ) grazing land
Røros area (kilo/km 2 )*
Røros area (kilo/animal)**
. Fig. 7.5 Pastoral productivity in the Sámi reindeer herding areas Røros and West Finnmark measured per animal (bars) and per km 2 (graph). (Source: Norwegian Agriculture Agency and Johnsen
and Benjaminsen (2017))
7.2 · Debates About Economic Irrationality Among Pastoralists
7
ably higher than in the other reindeer herding areas where the average is 15.1 kg/
km 2 even if the Arctic conditions in Finnmark are more difficult with more climatic
instability than what is found further south. This instability is also reflected in the
fluctuations in production found in West Finnmark.
The pastoral contribution to national economies in various African countries is
also often underestimated (Hesse and MacGregor 2006). This may be because
there is not political will to acknowledge this contribution, but also because it is
difficult to measure it. Nevertheless, pastoral production is estimated to represent
10% of Kenya’s Gross Domestic Product (GDP), which is approximately the same
as the agricultural contribution to GDP (Hesse and MacGregor 2006).
In Finnmark, reindeer pastoralism has changed from being a profitable activity
in the 1970s to becoming a subsidized economic activity (Reinert 2006). Reindeer
meat is after all a quality product produced outdoors with free-ranging animals
consuming natural feed, and with a limited production. Nevertheless, profitability
in reindeer-keeping fell dramatically from the 1970s to around 2010. For instance,
the price of one kilogram of meat fell from about 13 US dollars in 1976 to about 6
US dollars in 1990, before increasing to 8 US dollars in 2011 (measured in the
equivalent value of Norwegian kroner in 2011) (Reinert 2016). The main reason
for this negative development from the 1970s was that reindeer-keeping was
squeezed into a planning model where prices were fixed by the state and not in the
relationship between supply and demand. This model was based on ideas about
what is efficient production inspired by Norwegian farmers’ production of cattle
(Reinert 2016).
As long as the reindeer-keepers were able to govern their own business until the
late 1970s, that is as long as they had a fair amount of food sovereignty (see 7 Sect.
2.4 in 7 Chap. 2), they managed to run a profitable business. But when the state
took over with its planning model influenced by stationary forms of livestock0
5
10
15
20
25
30
35
40
1980
1982
1984
1986
1988
1990
1992
1994
1996
1998
2000
2002
2004
2006
2008
2010
2012
2014
2016
Meat production (kilo)
West Finnmark (kilo/animal)**
West Finnmark (kilo/km 2 )*
Meat production
**) Meat production (kilo) per reindeer in spring herd before calving
*) Meat production (kilo) per square kilometer (km 2 ) grazing land
Røros area (kilo/km 2 )*
Røros area (kilo/animal)**
. Fig. 7.5 Pastoral productivity in the Sámi reindeer herding areas Røros and West Finnmark measured per animal (bars) and per km 2 (graph). (Source: Norwegian Agriculture Agency and Johnsen
and Benjaminsen (2017))
7.2 · Debates About Economic Irrationality Among Pastoralists