

70
like the US National Ecological Observatory Network (NEON), we are able to test
relationships among traits and characterize functional diversity at unprecedented
scales. For example, NEON is collecting imaging spectroscopy data at 1 m resolution and waveform lidar data almost annually for 30 years at 81 10 km × 10 km sites
covering 20 biomes defined for the USA. With the addition of lidar, which enables
measuring traits such as plant area index, canopy height, canopy volume, and
aboveground biomass (of forests), a broad suite of traits can be leveraged to test
relationships that have been published in the literature (e.g., the leaf economics
spectrum) and are generally tested now at global scales using extensive—but still
not comprehensive—databases such as TRY. With spaceborne imaging, phenological variation in traits (e.g., Yang et al. 2016) can be further explored. For example,
preliminary mapping of key functional traits across all NEON biomes in the USA
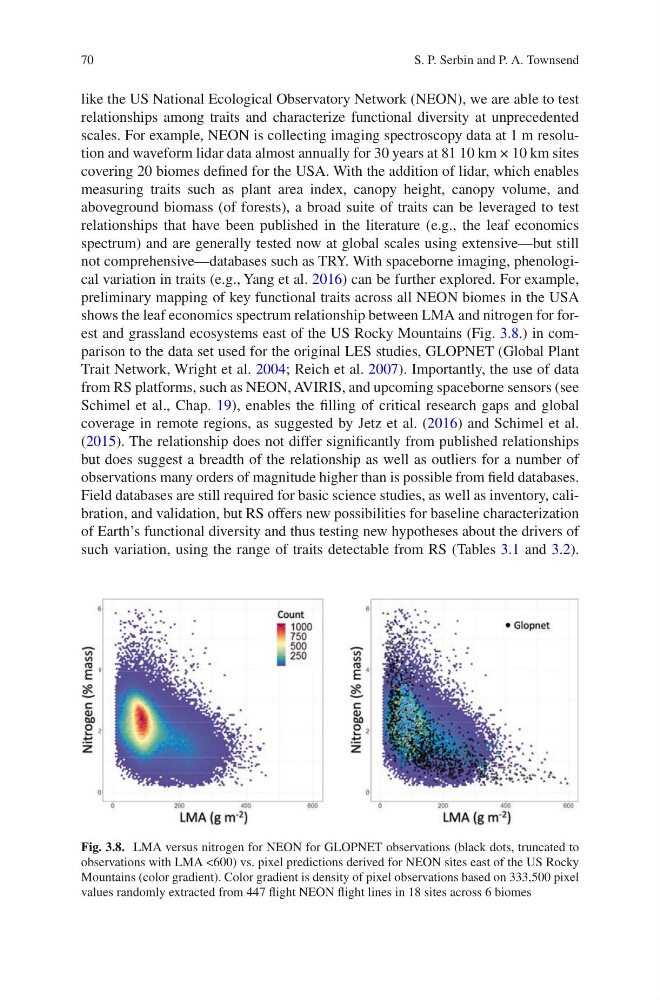
shows the leaf economics spectrum relationship between LMA and nitrogen for forest and grassland ecosystems east of the US Rocky Mountains (Fig. 3.8.) in comparison to the data set used for the original LES studies, GLOPNET (Global Plant
Trait Network, Wright et al. 2004; Reich et al. 2007). Importantly, the use of data
from RS platforms, such as NEON, AVIRIS, and upcoming spaceborne sensors (see
Schimel et al., Chap. 19), enables the filling of critical research gaps and global
coverage in remote regions, as suggested by Jetz et al. (2016) and Schimel et al.
(2015). The relationship does not differ significantly from published relationships
but does suggest a breadth of the relationship as well as outliers for a number of
observations many orders of magnitude higher than is possible from field databases.
Field databases are still required for basic science studies, as well as inventory, calibration, and validation, but RS offers new possibilities for baseline characterization
of Earth’s functional diversity and thus testing new hypotheses about the drivers of
such variation, using the range of traits detectable from RS (Tables 3.1 and 3.2).
Fig. 3.8. LMA versus nitrogen for NEON for GLOPNET observations (black dots, truncated to
observations with LMA <600) vs. pixel predictions derived for NEON sites east of the US Rocky
Mountains (color gradient). Color gradient is density of pixel observations based on 333,500 pixel
values randomly extracted from 447 flight NEON flight lines in 18 sites across 6 biomes
S. P. Serbin and P. A. Townsend
like the US National Ecological Observatory Network (NEON), we are able to test
relationships among traits and characterize functional diversity at unprecedented
scales. For example, NEON is collecting imaging spectroscopy data at 1 m resolution and waveform lidar data almost annually for 30 years at 81 10 km × 10 km sites
covering 20 biomes defined for the USA. With the addition of lidar, which enables
measuring traits such as plant area index, canopy height, canopy volume, and
aboveground biomass (of forests), a broad suite of traits can be leveraged to test
relationships that have been published in the literature (e.g., the leaf economics
spectrum) and are generally tested now at global scales using extensive—but still
not comprehensive—databases such as TRY. With spaceborne imaging, phenological variation in traits (e.g., Yang et al. 2016) can be further explored. For example,
preliminary mapping of key functional traits across all NEON biomes in the USA
shows the leaf economics spectrum relationship between LMA and nitrogen for forest and grassland ecosystems east of the US Rocky Mountains (Fig. 3.8.) in comparison to the data set used for the original LES studies, GLOPNET (Global Plant
Trait Network, Wright et al. 2004; Reich et al. 2007). Importantly, the use of data
from RS platforms, such as NEON, AVIRIS, and upcoming spaceborne sensors (see
Schimel et al., Chap. 19), enables the filling of critical research gaps and global
coverage in remote regions, as suggested by Jetz et al. (2016) and Schimel et al.
(2015). The relationship does not differ significantly from published relationships
but does suggest a breadth of the relationship as well as outliers for a number of
observations many orders of magnitude higher than is possible from field databases.
Field databases are still required for basic science studies, as well as inventory, calibration, and validation, but RS offers new possibilities for baseline characterization
of Earth’s functional diversity and thus testing new hypotheses about the drivers of
such variation, using the range of traits detectable from RS (Tables 3.1 and 3.2).
Fig. 3.8. LMA versus nitrogen for NEON for GLOPNET observations (black dots, truncated to
observations with LMA <600) vs. pixel predictions derived for NEON sites east of the US Rocky
Mountains (color gradient). Color gradient is density of pixel observations based on 333,500 pixel
values randomly extracted from 447 flight NEON flight lines in 18 sites across 6 biomes
S. P. Serbin and P. A. Townsend