

514
somewhat on the ecosystem type or the gradient of ecosystem types. If, for example,
the diversity of plant functional traits estimated within a region (Asner et al. 2017)
were to be used to look at some aspect of plant competition, assuming that plants
with different functional traits are interacting competitively (as in many individualbased forest models), how would pixel-level diversity be used in such a framework?
This requires research and validation to determine, since these models are usually
built around data collected in association with taxonomic identification, or highly
aggregated into generalized plant functional types. The pixel-level data could be
intermediate between these current practices.
The scale mismatch also raises challenges with calibration and validation of
plant functional trait estimates. In situ, these measurements are normally made on
individual leaves or other tissue, or small composites of leaves, samples typically
1/10
7
the size of a pixel. Within a pixel, distributed either horizontally or vertically
within a canopy, trait values may vary dramatically (Schimel et al. 1991b; Serbin
et al. 2014), and careful extrapolation is required to even compare with remote
observations (Singh et al. 2015). This extrapolation itself has to be done differently,
for example, in forests where vertically sun and shade leaves differ, compared to
grasslands, where hundreds of species may partition the environment, varying in
traits within this pixel and sampling representatively can be very challenging.
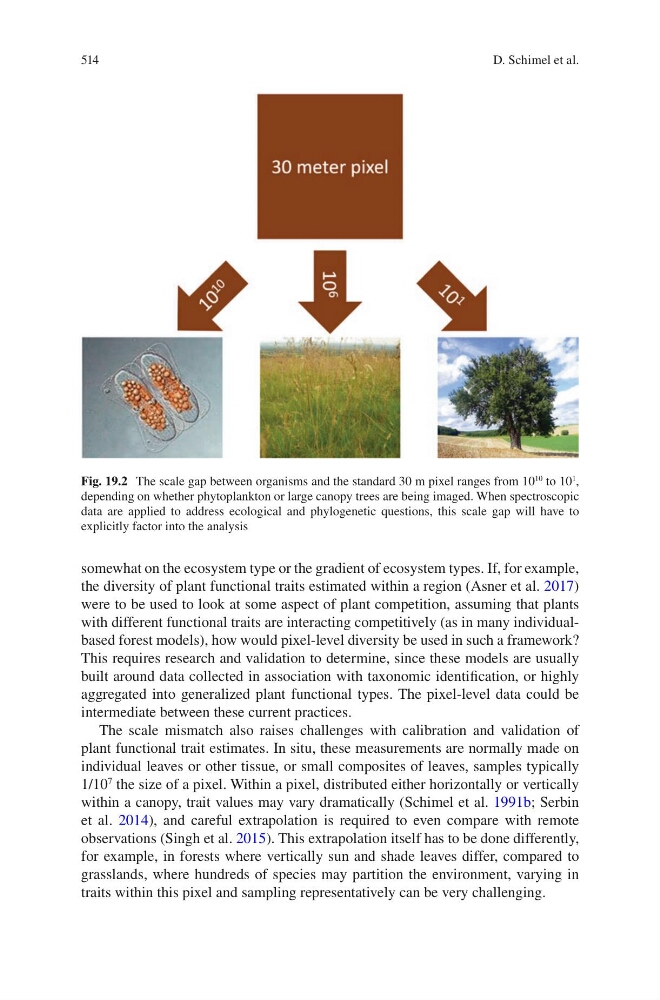
Fig. 19.2 The scale gap between organisms and the standard 30 m pixel ranges from 10
10 to 10
1 ,
depending on whether phytoplankton or large canopy trees are being imaged. When spectroscopic
data are applied to address ecological and phylogenetic questions, this scale gap will have to
explicitly factor into the analysis
D. Schimel et al.
somewhat on the ecosystem type or the gradient of ecosystem types. If, for example,
the diversity of plant functional traits estimated within a region (Asner et al. 2017)
were to be used to look at some aspect of plant competition, assuming that plants
with different functional traits are interacting competitively (as in many individualbased forest models), how would pixel-level diversity be used in such a framework?
This requires research and validation to determine, since these models are usually
built around data collected in association with taxonomic identification, or highly
aggregated into generalized plant functional types. The pixel-level data could be
intermediate between these current practices.
The scale mismatch also raises challenges with calibration and validation of
plant functional trait estimates. In situ, these measurements are normally made on
individual leaves or other tissue, or small composites of leaves, samples typically
1/10
7
the size of a pixel. Within a pixel, distributed either horizontally or vertically
within a canopy, trait values may vary dramatically (Schimel et al. 1991b; Serbin
et al. 2014), and careful extrapolation is required to even compare with remote
observations (Singh et al. 2015). This extrapolation itself has to be done differently,
for example, in forests where vertically sun and shade leaves differ, compared to
grasslands, where hundreds of species may partition the environment, varying in
traits within this pixel and sampling representatively can be very challenging.
Fig. 19.2 The scale gap between organisms and the standard 30 m pixel ranges from 10
10 to 10
1 ,
depending on whether phytoplankton or large canopy trees are being imaged. When spectroscopic
data are applied to address ecological and phylogenetic questions, this scale gap will have to
explicitly factor into the analysis
D. Schimel et al.