

492
spatially continuous and temporally consistent EBV products for species distributions, from the integration of multiple data sources, including traditional direct species observations collected in many different ways, automated records from sensor
networks—such as camera traps and sound detection—and emerging uses of satellite remote sensing (RS) for detecting species (Kissling et al. 2018a). These workflows pay special attention to the integration among in-situ observations and RS
data. Other approaches may use in-situ observations only as ground-truth data,
while the rest of the process is dominated by image processing (e.g., mapping vegetation cover; Hansen et al. 2013). However, traceability of the ground-truth sampling and processing remains equally important and therefore also applies to the
entire process similar principles of annotation, uncertainty reporting, and conformance with data management guidelines (see below).
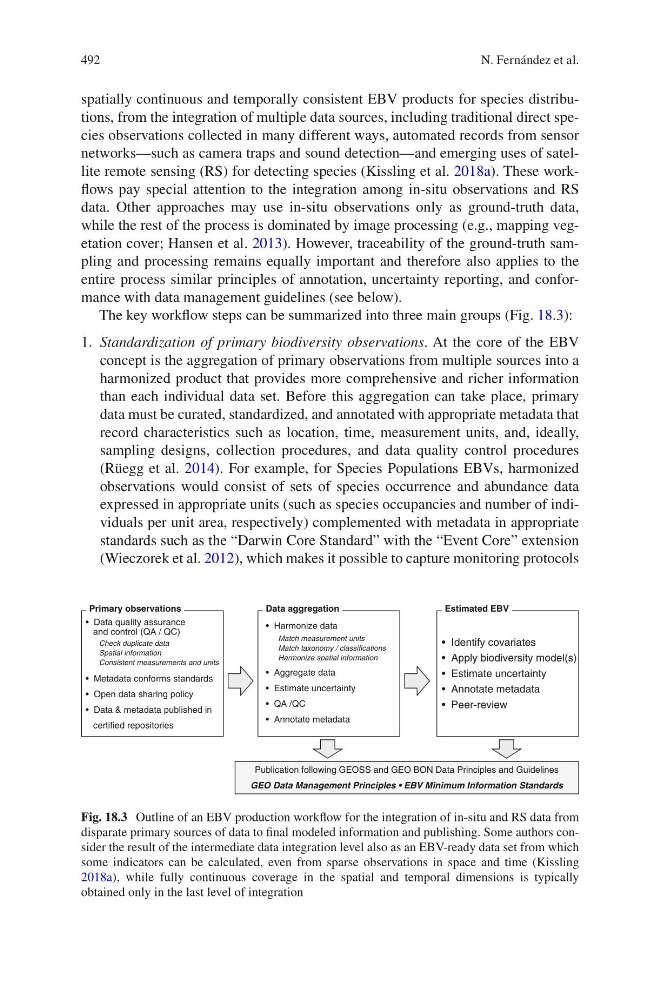
The key workflow steps can be summarized into three main groups (Fig. 18.3):
1. Standardization of primary biodiversity observations. At the core of the EBV
concept is the aggregation of primary observations from multiple sources into a
harmonized product that provides more comprehensive and richer information
than each individual data set. Before this aggregation can take place, primary
data must be curated, standardized, and annotated with appropriate metadata that
record characteristics such as location, time, measurement units, and, ideally,
sampling designs, collection procedures, and data quality control procedures
(Rüegg et al. 2014). For example, for Species Populations EBVs, harmonized
observations would consist of sets of species occurrence and abundance data
expressed in appropriate units (such as species occupancies and number of individuals per unit area, respectively) complemented with metadata in appropriate
standards such as the “Darwin Core Standard” with the “Event Core” extension
(Wieczorek et al. 2012), which makes it possible to capture monitoring protocols
• Data quality assurance
and control (QA / QC)
• Metadata conforms standards
• Open data sharing policy
• Data & metadata published in
certified repositories
Check duplicate data
Spatial information
Consistent measurements and units
Match measurement units
Match taxonomy / classifications
Harmonize spatial information
Primary observations
Data aggregation
Estimated EBV
• Harmonize data
• Aggregate data
• Estimate uncertainty
• QA /QC
• Annotate metadata
Publication following GEOSS and GEO BON Data Principles and Guidelines
GEO Data Management Principles • EBV Minimum Information Standards
• Identify covariates
• Apply biodiversity model(s)
• Estimate uncertainty
• Annotate metadata
• Peer-review
Fig. 18.3 Outline of an EBV production workflow for the integration of in-situ and RS data from
disparate primary sources of data to final modeled information and publishing. Some authors consider the result of the intermediate data integration level also as an EBV-ready data set from which
some indicators can be calculated, even from sparse observations in space and time (Kissling
2018a), while fully continuous coverage in the spatial and temporal dimensions is typically
obtained only in the last level of integration
N. Fernández et al.
spatially continuous and temporally consistent EBV products for species distributions, from the integration of multiple data sources, including traditional direct species observations collected in many different ways, automated records from sensor
networks—such as camera traps and sound detection—and emerging uses of satellite remote sensing (RS) for detecting species (Kissling et al. 2018a). These workflows pay special attention to the integration among in-situ observations and RS
data. Other approaches may use in-situ observations only as ground-truth data,
while the rest of the process is dominated by image processing (e.g., mapping vegetation cover; Hansen et al. 2013). However, traceability of the ground-truth sampling and processing remains equally important and therefore also applies to the
entire process similar principles of annotation, uncertainty reporting, and conformance with data management guidelines (see below).
The key workflow steps can be summarized into three main groups (Fig. 18.3):
1. Standardization of primary biodiversity observations. At the core of the EBV
concept is the aggregation of primary observations from multiple sources into a
harmonized product that provides more comprehensive and richer information
than each individual data set. Before this aggregation can take place, primary
data must be curated, standardized, and annotated with appropriate metadata that
record characteristics such as location, time, measurement units, and, ideally,
sampling designs, collection procedures, and data quality control procedures
(Rüegg et al. 2014). For example, for Species Populations EBVs, harmonized
observations would consist of sets of species occurrence and abundance data
expressed in appropriate units (such as species occupancies and number of individuals per unit area, respectively) complemented with metadata in appropriate
standards such as the “Darwin Core Standard” with the “Event Core” extension
(Wieczorek et al. 2012), which makes it possible to capture monitoring protocols
• Data quality assurance
and control (QA / QC)
• Metadata conforms standards
• Open data sharing policy
• Data & metadata published in
certified repositories
Check duplicate data
Spatial information
Consistent measurements and units
Match measurement units
Match taxonomy / classifications
Harmonize spatial information
Primary observations
Data aggregation
Estimated EBV
• Harmonize data
• Aggregate data
• Estimate uncertainty
• QA /QC
• Annotate metadata
Publication following GEOSS and GEO BON Data Principles and Guidelines
GEO Data Management Principles • EBV Minimum Information Standards
• Identify covariates
• Apply biodiversity model(s)
• Estimate uncertainty
• Annotate metadata
• Peer-review
Fig. 18.3 Outline of an EBV production workflow for the integration of in-situ and RS data from
disparate primary sources of data to final modeled information and publishing. Some authors consider the result of the intermediate data integration level also as an EBV-ready data set from which
some indicators can be calculated, even from sparse observations in space and time (Kissling
2018a), while fully continuous coverage in the spatial and temporal dimensions is typically
obtained only in the last level of integration
N. Fernández et al.