

471
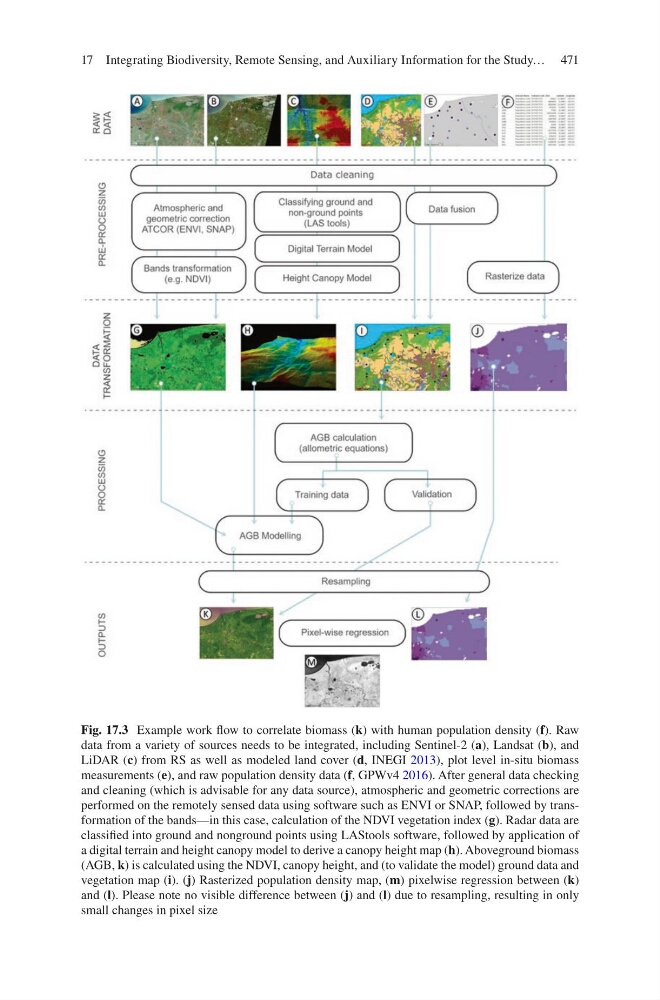
Fig. 17.3 Example work flow to correlate biomass (k) with human population density (f). Raw
data from a variety of sources needs to be integrated, including Sentinel-2 (a), Landsat (b), and
LiDAR (c) from RS as well as modeled land cover (d, INEGI 2013), plot level in-situ biomass
measurements (e), and raw population density data (f, GPWv4 2016). After general data checking
and cleaning (which is advisable for any data source), atmospheric and geometric corrections are
performed on the remotely sensed data using software such as ENVI or SNAP, followed by transformation of the bands—in this case, calculation of the NDVI vegetation index (g). Radar data are
classified into ground and nonground points using LAStools software, followed by application of
a digital terrain and height canopy model to derive a canopy height map (h). Aboveground biomass
(AGB, k) is calculated using the NDVI, canopy height, and (to validate the model) ground data and
vegetation map (i). (j) Rasterized population density map, (m) pixelwise regression between (k)
and (l). Please note no visible difference between (j) and (l) due to resampling, resulting in only
small changes in pixel size
17 Integrating Biodiversity, Remote Sensing, and Auxiliary Information for the Study…
Fig. 17.3 Example work flow to correlate biomass (k) with human population density (f). Raw
data from a variety of sources needs to be integrated, including Sentinel-2 (a), Landsat (b), and
LiDAR (c) from RS as well as modeled land cover (d, INEGI 2013), plot level in-situ biomass
measurements (e), and raw population density data (f, GPWv4 2016). After general data checking
and cleaning (which is advisable for any data source), atmospheric and geometric corrections are
performed on the remotely sensed data using software such as ENVI or SNAP, followed by transformation of the bands—in this case, calculation of the NDVI vegetation index (g). Radar data are
classified into ground and nonground points using LAStools software, followed by application of
a digital terrain and height canopy model to derive a canopy height map (h). Aboveground biomass
(AGB, k) is calculated using the NDVI, canopy height, and (to validate the model) ground data and
vegetation map (i). (j) Rasterized population density map, (m) pixelwise regression between (k)
and (l). Please note no visible difference between (j) and (l) due to resampling, resulting in only
small changes in pixel size
17 Integrating Biodiversity, Remote Sensing, and Auxiliary Information for the Study…