

467
values than species missing in TRY (Sandel et al. 2015). Although plant functional
traits are conventionally measured at the peak of the growing season and in full light
conditions (top of canopy) (Pérez-Harguindeguy et al. 2013), one of the most commonly measured traits, specific leaf area (SLA) has been shown to have values in
TRY that are typical of partial canopy shading (Keenan and Niinemets 2016). Due
to the extremely diverse nature of studies contributing data to the TRY database,
most entries have on average only three traits measured simultaneously, which
makes multivariate analyses at the individual plant level extremely challenging
(Schrodt et al. 2015).
These issues are mainly due to studies represented within these databases not
necessarily following standardized protocols (e.g., Pérez-Harguindeguy et al. 2013),
studies having different foci, data from opportunistic sampling (Maes et al. 2015)
being mixed with data from directed approaches, and rare species, from a purely
statistical viewpoint, being less likely to be measured. As such, avoiding them at the
database level, especially where such a large number of data entries are managed in
open access databases (e.g., Version 4 of TRY contained almost seven million trait
records), is currently virtually impossible. An additional challenge when using trait
data in tandem with RS is the lack of geo-referenced measurements within trait databases. For example, only about 60% of all data points within TRY are geo- referenced
with variable levels of precision.
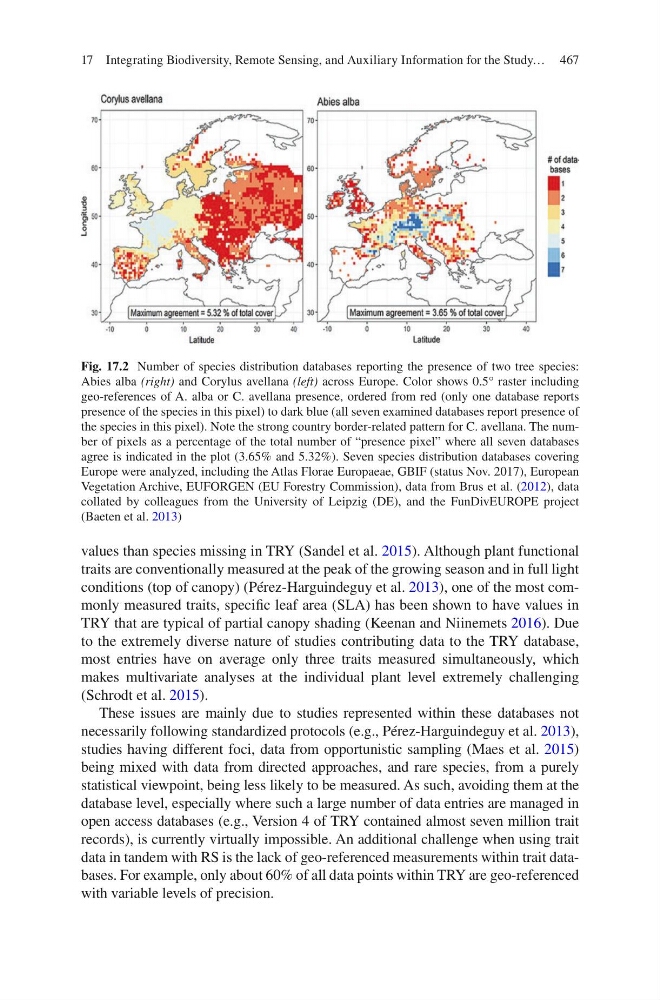
Fig. 17.2 Number of species distribution databases reporting the presence of two tree species:
Abies alba (right) and Corylus avellana (left) across Europe. Color shows 0.5° raster including
geo-references of A. alba or C. avellana presence, ordered from red (only one database reports
presence of the species in this pixel) to dark blue (all seven examined databases report presence of
the species in this pixel). Note the strong country border-related pattern for C. avellana. The number of pixels as a percentage of the total number of “presence pixel” where all seven databases
agree is indicated in the plot (3.65% and 5.32%). Seven species distribution databases covering
Europe were analyzed, including the Atlas Florae Europaeae, GBIF (status Nov. 2017), European
Vegetation Archive, EUFORGEN (EU Forestry Commission), data from Brus et al. (2012), data
collated by colleagues from the University of Leipzig (DE), and the FunDivEUROPE project
(Baeten et al. 2013)
17 Integrating Biodiversity, Remote Sensing, and Auxiliary Information for the Study…
values than species missing in TRY (Sandel et al. 2015). Although plant functional
traits are conventionally measured at the peak of the growing season and in full light
conditions (top of canopy) (Pérez-Harguindeguy et al. 2013), one of the most commonly measured traits, specific leaf area (SLA) has been shown to have values in
TRY that are typical of partial canopy shading (Keenan and Niinemets 2016). Due
to the extremely diverse nature of studies contributing data to the TRY database,
most entries have on average only three traits measured simultaneously, which
makes multivariate analyses at the individual plant level extremely challenging
(Schrodt et al. 2015).
These issues are mainly due to studies represented within these databases not
necessarily following standardized protocols (e.g., Pérez-Harguindeguy et al. 2013),
studies having different foci, data from opportunistic sampling (Maes et al. 2015)
being mixed with data from directed approaches, and rare species, from a purely
statistical viewpoint, being less likely to be measured. As such, avoiding them at the
database level, especially where such a large number of data entries are managed in
open access databases (e.g., Version 4 of TRY contained almost seven million trait
records), is currently virtually impossible. An additional challenge when using trait
data in tandem with RS is the lack of geo-referenced measurements within trait databases. For example, only about 60% of all data points within TRY are geo- referenced
with variable levels of precision.
Fig. 17.2 Number of species distribution databases reporting the presence of two tree species:
Abies alba (right) and Corylus avellana (left) across Europe. Color shows 0.5° raster including
geo-references of A. alba or C. avellana presence, ordered from red (only one database reports
presence of the species in this pixel) to dark blue (all seven examined databases report presence of
the species in this pixel). Note the strong country border-related pattern for C. avellana. The number of pixels as a percentage of the total number of “presence pixel” where all seven databases
agree is indicated in the plot (3.65% and 5.32%). Seven species distribution databases covering
Europe were analyzed, including the Atlas Florae Europaeae, GBIF (status Nov. 2017), European
Vegetation Archive, EUFORGEN (EU Forestry Commission), data from Brus et al. (2012), data
collated by colleagues from the University of Leipzig (DE), and the FunDivEUROPE project
(Baeten et al. 2013)
17 Integrating Biodiversity, Remote Sensing, and Auxiliary Information for the Study…