

426
biodiversity monitoring system (Scholes et al. 2012; Pereira et al. 2013; Turner
2014; Jetz et al. 2016; Geller et al. Chap. 20).
In response to this need for a more complete accounting of biodiversity, there
have been several recent attempts to define Essential Biodiversity Variables (EBVs),
many of which involve RS (Pereira et al. 2013; Turner 2014; Vihervaara et al. 2017;
Fernández et al., Chap. 18). However, most of the appeals for a global biodiversity
monitoring system involving RS have not fully addressed the topic of how RS would
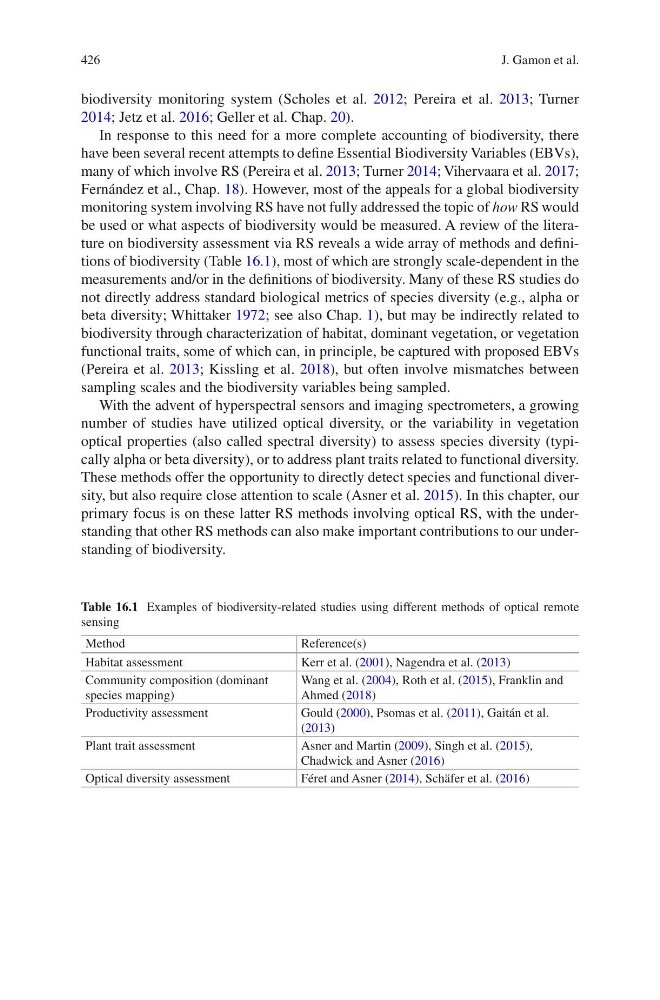
be used or what aspects of biodiversity would be measured. A review of the literature on biodiversity assessment via RS reveals a wide array of methods and definitions of biodiversity (Table 16.1), most of which are strongly scale-dependent in the
measurements and/or in the definitions of biodiversity. Many of these RS studies do
not directly address standard biological metrics of species diversity (e.g., alpha or
beta diversity; Whittaker 1972; see also Chap. 1), but may be indirectly related to
biodiversity through characterization of habitat, dominant vegetation, or vegetation
functional traits, some of which can, in principle, be captured with proposed EBVs
(Pereira et al. 2013; Kissling et al. 2018), but often involve mismatches between
sampling scales and the biodiversity variables being sampled.
With the advent of hyperspectral sensors and imaging spectrometers, a growing
number of studies have utilized optical diversity, or the variability in vegetation
optical properties (also called spectral diversity) to assess species diversity (typically alpha or beta diversity), or to address plant traits related to functional diversity.
These methods offer the opportunity to directly detect species and functional diversity, but also require close attention to scale (Asner et al. 2015). In this chapter, our
primary focus is on these latter RS methods involving optical RS, with the understanding that other RS methods can also make important contributions to our understanding of biodiversity.
Table 16.1 Examples of biodiversity-related studies using different methods of optical remote
sensing
Method
Reference(s)
Habitat assessment
Kerr et al. (2001), Nagendra et al. (2013)
Community composition (dominant
species mapping)
Wang et al. (2004), Roth et al. (2015), Franklin and
Ahmed (2018)
Productivity assessment
Gould (2000), Psomas et al. (2011), Gaitán et al.
(2013)
Plant trait assessment
Asner and Martin (2009), Singh et al. (2015),
Chadwick and Asner (2016)
Optical diversity assessment
Féret and Asner (2014), Schäfer et al. (2016)
J. Gamon et al.
biodiversity monitoring system (Scholes et al. 2012; Pereira et al. 2013; Turner
2014; Jetz et al. 2016; Geller et al. Chap. 20).
In response to this need for a more complete accounting of biodiversity, there
have been several recent attempts to define Essential Biodiversity Variables (EBVs),
many of which involve RS (Pereira et al. 2013; Turner 2014; Vihervaara et al. 2017;
Fernández et al., Chap. 18). However, most of the appeals for a global biodiversity
monitoring system involving RS have not fully addressed the topic of how RS would
be used or what aspects of biodiversity would be measured. A review of the literature on biodiversity assessment via RS reveals a wide array of methods and definitions of biodiversity (Table 16.1), most of which are strongly scale-dependent in the
measurements and/or in the definitions of biodiversity. Many of these RS studies do
not directly address standard biological metrics of species diversity (e.g., alpha or
beta diversity; Whittaker 1972; see also Chap. 1), but may be indirectly related to
biodiversity through characterization of habitat, dominant vegetation, or vegetation
functional traits, some of which can, in principle, be captured with proposed EBVs
(Pereira et al. 2013; Kissling et al. 2018), but often involve mismatches between
sampling scales and the biodiversity variables being sampled.
With the advent of hyperspectral sensors and imaging spectrometers, a growing
number of studies have utilized optical diversity, or the variability in vegetation
optical properties (also called spectral diversity) to assess species diversity (typically alpha or beta diversity), or to address plant traits related to functional diversity.
These methods offer the opportunity to directly detect species and functional diversity, but also require close attention to scale (Asner et al. 2015). In this chapter, our
primary focus is on these latter RS methods involving optical RS, with the understanding that other RS methods can also make important contributions to our understanding of biodiversity.
Table 16.1 Examples of biodiversity-related studies using different methods of optical remote
sensing
Method
Reference(s)
Habitat assessment
Kerr et al. (2001), Nagendra et al. (2013)
Community composition (dominant
species mapping)
Wang et al. (2004), Roth et al. (2015), Franklin and
Ahmed (2018)
Productivity assessment
Gould (2000), Psomas et al. (2011), Gaitán et al.
(2013)
Plant trait assessment
Asner and Martin (2009), Singh et al. (2015),
Chadwick and Asner (2016)
Optical diversity assessment
Féret and Asner (2014), Schäfer et al. (2016)
J. Gamon et al.