

358
25°
#1
#1
#2
#2
Chlorophyll content (µg/cm
2
)
Chlorophyll content (µg/cm
2 )
-160
0 20 40 60 80 100
Relative flux (%)
Relative flux (%)
120 0 20 40 60 80 100
140
120
0 20 40 60 80 100
Relative flux (%)
Relative flux (%)
120 0 20 40 60 80 100
140
120
LE
LE
SM
PP
UE
SM
PP
UE
-140
-120
-100
-80
Leaf depth (µm)
-40
-60
-20
0
-160
-140
-120
-100
-80
Leaf depth (µm)
-40
-60
-20
0
#3
#3
#4
#4
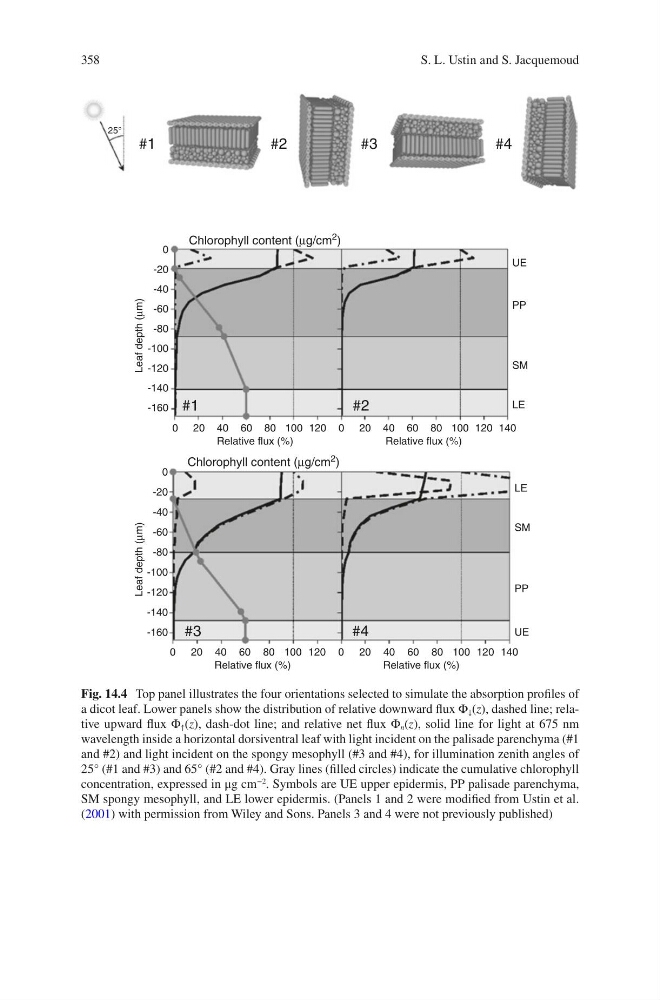
Fig. 14.4 Top panel illustrates the four orientations selected to simulate the absorption profiles of
a dicot leaf. Lower panels show the distribution of relative downward flux Φ ↓ (z), dashed line; relative upward flux Φ ↑ (z), dash-dot line; and relative net flux Φ n (z), solid line for light at 675 nm
wavelength inside a horizontal dorsiventral leaf with light incident on the palisade parenchyma (#1
and #2) and light incident on the spongy mesophyll (#3 and #4), for illumination zenith angles of
25° (#1 and #3) and 65° (#2 and #4). Gray lines (filled circles) indicate the cumulative chlorophyll
concentration, expressed in μg cm
−2 . Symbols are UE upper epidermis, PP palisade parenchyma,
SM spongy mesophyll, and LE lower epidermis. (Panels 1 and 2 were modified from Ustin et al.
(2001) with permission from Wiley and Sons. Panels 3 and 4 were not previously published)
S. L. Ustin and S. Jacquemoud
25°
#1
#1
#2
#2
Chlorophyll content (µg/cm
2
)
Chlorophyll content (µg/cm
2 )
-160
0 20 40 60 80 100
Relative flux (%)
Relative flux (%)
120 0 20 40 60 80 100
140
120
0 20 40 60 80 100
Relative flux (%)
Relative flux (%)
120 0 20 40 60 80 100
140
120
LE
LE
SM
PP
UE
SM
PP
UE
-140
-120
-100
-80
Leaf depth (µm)
-40
-60
-20
0
-160
-140
-120
-100
-80
Leaf depth (µm)
-40
-60
-20
0
#3
#3
#4
#4
Fig. 14.4 Top panel illustrates the four orientations selected to simulate the absorption profiles of
a dicot leaf. Lower panels show the distribution of relative downward flux Φ ↓ (z), dashed line; relative upward flux Φ ↑ (z), dash-dot line; and relative net flux Φ n (z), solid line for light at 675 nm
wavelength inside a horizontal dorsiventral leaf with light incident on the palisade parenchyma (#1
and #2) and light incident on the spongy mesophyll (#3 and #4), for illumination zenith angles of
25° (#1 and #3) and 65° (#2 and #4). Gray lines (filled circles) indicate the cumulative chlorophyll
concentration, expressed in μg cm
−2 . Symbols are UE upper epidermis, PP palisade parenchyma,
SM spongy mesophyll, and LE lower epidermis. (Panels 1 and 2 were modified from Ustin et al.
(2001) with permission from Wiley and Sons. Panels 3 and 4 were not previously published)
S. L. Ustin and S. Jacquemoud