

284
From an RS perspective, the layered canopy, many species, and mixed pixels make it
hard to map target IAS within this complex community mosaic.
Community complexity can often be overcome by taking advantage of differences in phenology. Acquiring imagery during flowering or senescence when the
target IAS is most distinct from its surrounding vegetation may allow for detection
at the species level. For example, Landsat ETM+ and QuickBird have been used to
take advantage of correct timing and fine spatial resolution, respectively, to distinguish riparian IAS (Laba et al. 2008; West et al. 2017). Frequently, increasing spectral data further has been necessary to detect riparian IAS. (Ustin et al. 2002; Laba
et al. 2005; Hamada et al. 2007; Andrew and Ustin 2008).
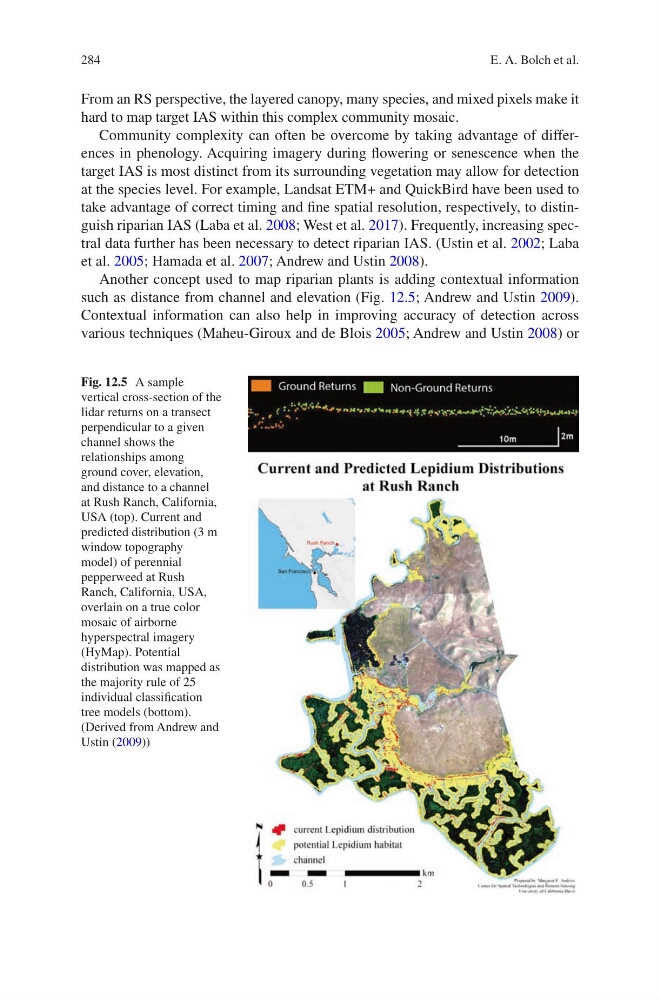
Another concept used to map riparian plants is adding contextual information
such as distance from channel and elevation (Fig. 12.5; Andrew and Ustin 2009).
Contextual information can also help in improving accuracy of detection across
various techniques (Maheu-Giroux and de Blois 2005; Andrew and Ustin 2008) or
Fig. 12.5 A sample
vertical cross-section of the
lidar returns on a transect
perpendicular to a given
channel shows the
relationships among
ground cover, elevation,
and distance to a channel
at Rush Ranch, California,
USA (top). Current and
predicted distribution (3 m
window topography
model) of perennial
pepperweed at Rush
Ranch, California, USA,
overlain on a true color
mosaic of airborne
hyperspectral imagery
(HyMap). Potential
distribution was mapped as
the majority rule of 25
individual classification
tree models (bottom).
(Derived from Andrew and
Ustin (2009))
E. A. Bolch et al.
From an RS perspective, the layered canopy, many species, and mixed pixels make it
hard to map target IAS within this complex community mosaic.
Community complexity can often be overcome by taking advantage of differences in phenology. Acquiring imagery during flowering or senescence when the
target IAS is most distinct from its surrounding vegetation may allow for detection
at the species level. For example, Landsat ETM+ and QuickBird have been used to
take advantage of correct timing and fine spatial resolution, respectively, to distinguish riparian IAS (Laba et al. 2008; West et al. 2017). Frequently, increasing spectral data further has been necessary to detect riparian IAS. (Ustin et al. 2002; Laba
et al. 2005; Hamada et al. 2007; Andrew and Ustin 2008).
Another concept used to map riparian plants is adding contextual information
such as distance from channel and elevation (Fig. 12.5; Andrew and Ustin 2009).
Contextual information can also help in improving accuracy of detection across
various techniques (Maheu-Giroux and de Blois 2005; Andrew and Ustin 2008) or
Fig. 12.5 A sample
vertical cross-section of the
lidar returns on a transect
perpendicular to a given
channel shows the
relationships among
ground cover, elevation,
and distance to a channel
at Rush Ranch, California,
USA (top). Current and
predicted distribution (3 m
window topography
model) of perennial
pepperweed at Rush
Ranch, California, USA,
overlain on a true color
mosaic of airborne
hyperspectral imagery
(HyMap). Potential
distribution was mapped as
the majority rule of 25
individual classification
tree models (bottom).
(Derived from Andrew and
Ustin (2009))
E. A. Bolch et al.