

280
vegetation functional types. Indirect methods include multisource data for inferring
IAS distributions and coupled RS observations and modeling. For example, the
National Land Cover Database (NLCD), which is derived from Landsat data, has
been used in combination with EROS Moderate Resolution Imaging
Spectroradiometer (eMODIS) vegetation products (Jenkerson et al. 2010) to create
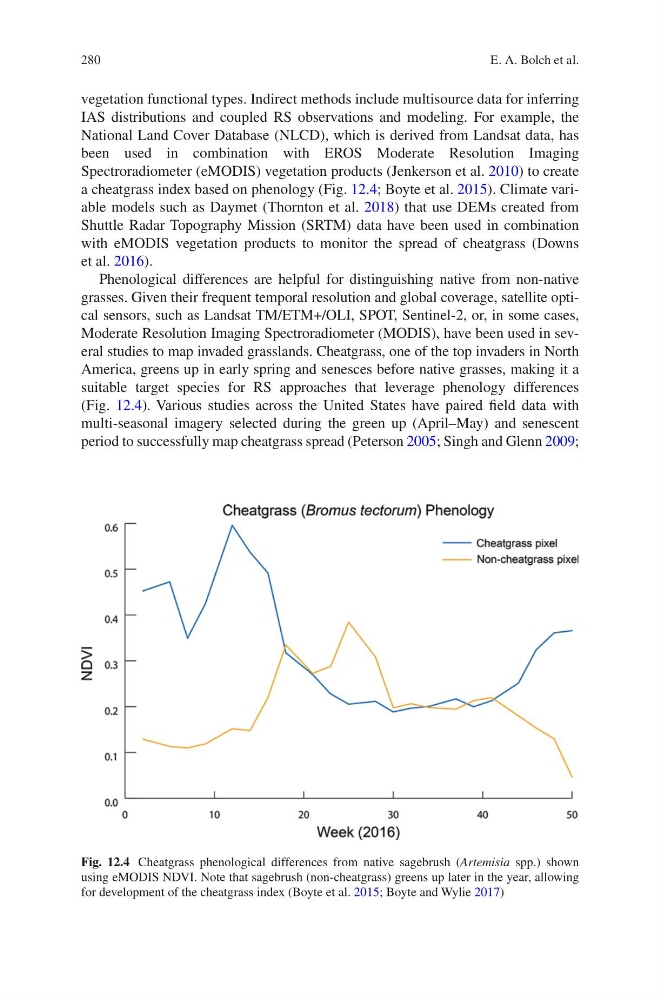
a cheatgrass index based on phenology (Fig. 12.4; Boyte et al. 2015). Climate variable models such as Daymet (Thornton et al. 2018) that use DEMs created from
Shuttle Radar Topography Mission (SRTM) data have been used in combination
with eMODIS vegetation products to monitor the spread of cheatgrass (Downs
et al. 2016).
Phenological differences are helpful for distinguishing native from non-native
grasses. Given their frequent temporal resolution and global coverage, satellite optical sensors, such as Landsat TM/ETM+/OLI, SPOT, Sentinel-2, or, in some cases,
Moderate Resolution Imaging Spectroradiometer (MODIS), have been used in several studies to map invaded grasslands. Cheatgrass, one of the top invaders in North
America, greens up in early spring and senesces before native grasses, making it a
suitable target species for RS approaches that leverage phenology differences
(Fig. 12.4). Various studies across the United States have paired field data with
multi-seasonal imagery selected during the green up (April–May) and senescent
period to successfully map cheatgrass spread (Peterson 2005; Singh and Glenn 2009;
Fig. 12.4 Cheatgrass phenological differences from native sagebrush (Artemisia spp.) shown
using eMODIS NDVI. Note that sagebrush (non-cheatgrass) greens up later in the year, allowing
for development of the cheatgrass index (Boyte et al. 2015; Boyte and Wylie 2017)
E. A. Bolch et al.
vegetation functional types. Indirect methods include multisource data for inferring
IAS distributions and coupled RS observations and modeling. For example, the
National Land Cover Database (NLCD), which is derived from Landsat data, has
been used in combination with EROS Moderate Resolution Imaging
Spectroradiometer (eMODIS) vegetation products (Jenkerson et al. 2010) to create
a cheatgrass index based on phenology (Fig. 12.4; Boyte et al. 2015). Climate variable models such as Daymet (Thornton et al. 2018) that use DEMs created from
Shuttle Radar Topography Mission (SRTM) data have been used in combination
with eMODIS vegetation products to monitor the spread of cheatgrass (Downs
et al. 2016).
Phenological differences are helpful for distinguishing native from non-native
grasses. Given their frequent temporal resolution and global coverage, satellite optical sensors, such as Landsat TM/ETM+/OLI, SPOT, Sentinel-2, or, in some cases,
Moderate Resolution Imaging Spectroradiometer (MODIS), have been used in several studies to map invaded grasslands. Cheatgrass, one of the top invaders in North
America, greens up in early spring and senesces before native grasses, making it a
suitable target species for RS approaches that leverage phenology differences
(Fig. 12.4). Various studies across the United States have paired field data with
multi-seasonal imagery selected during the green up (April–May) and senescent
period to successfully map cheatgrass spread (Peterson 2005; Singh and Glenn 2009;
Fig. 12.4 Cheatgrass phenological differences from native sagebrush (Artemisia spp.) shown
using eMODIS NDVI. Note that sagebrush (non-cheatgrass) greens up later in the year, allowing
for development of the cheatgrass index (Boyte et al. 2015; Boyte and Wylie 2017)
E. A. Bolch et al.