

277
Indeed, invasion of the forest understory is relatively understudied. Dense canopies mask understory contribution to the RS signal. To address this, researchers
have turned to leveraging forest phenology to directly detect the understory when it
is most visible. Resasco et al. (2007) mapped the historical spread of Amur honeysuckle (Lonicera maackii) during leaf-off conditions of the native forest using the
Soil Adjusted Atmospheric Resistant Vegetation Index calculated from Landsat TM
and ETM+ from 1999 to 2006. Wilfong et al. (2009) found that using a difference
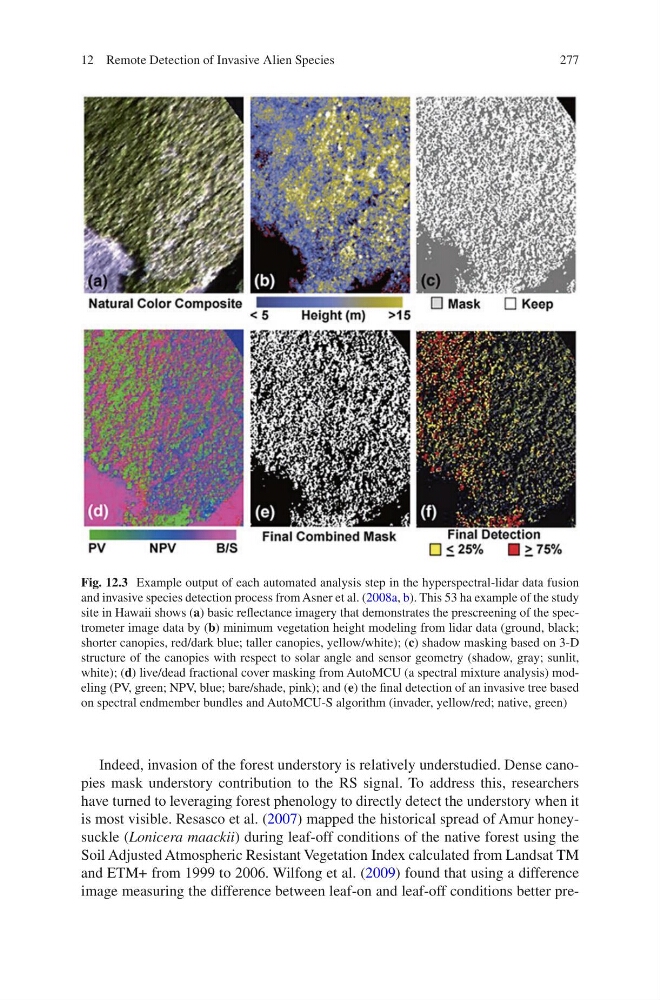
image measuring the difference between leaf-on and leaf-off conditions better preFig. 12.3 Example output of each automated analysis step in the hyperspectral-lidar data fusion
and invasive species detection process from Asner et al. (2008a, b). This 53 ha example of the study
site in Hawaii shows (a) basic reflectance imagery that demonstrates the prescreening of the spectrometer image data by (b) minimum vegetation height modeling from lidar data (ground, black;
shorter canopies, red/dark blue; taller canopies, yellow/white); (c) shadow masking based on 3-D
structure of the canopies with respect to solar angle and sensor geometry (shadow, gray; sunlit,
white); (d) live/dead fractional cover masking from AutoMCU (a spectral mixture analysis) modeling (PV, green; NPV, blue; bare/shade, pink); and (e) the final detection of an invasive tree based
on spectral endmember bundles and AutoMCU-S algorithm (invader, yellow/red; native, green)
12 Remote Detection of Invasive Alien Species
Indeed, invasion of the forest understory is relatively understudied. Dense canopies mask understory contribution to the RS signal. To address this, researchers
have turned to leveraging forest phenology to directly detect the understory when it
is most visible. Resasco et al. (2007) mapped the historical spread of Amur honeysuckle (Lonicera maackii) during leaf-off conditions of the native forest using the
Soil Adjusted Atmospheric Resistant Vegetation Index calculated from Landsat TM
and ETM+ from 1999 to 2006. Wilfong et al. (2009) found that using a difference
image measuring the difference between leaf-on and leaf-off conditions better preFig. 12.3 Example output of each automated analysis step in the hyperspectral-lidar data fusion
and invasive species detection process from Asner et al. (2008a, b). This 53 ha example of the study
site in Hawaii shows (a) basic reflectance imagery that demonstrates the prescreening of the spectrometer image data by (b) minimum vegetation height modeling from lidar data (ground, black;
shorter canopies, red/dark blue; taller canopies, yellow/white); (c) shadow masking based on 3-D
structure of the canopies with respect to solar angle and sensor geometry (shadow, gray; sunlit,
white); (d) live/dead fractional cover masking from AutoMCU (a spectral mixture analysis) modeling (PV, green; NPV, blue; bare/shade, pink); and (e) the final detection of an invasive tree based
on spectral endmember bundles and AutoMCU-S algorithm (invader, yellow/red; native, green)
12 Remote Detection of Invasive Alien Species