

228
10.2 Geodiversity Indices
Geodiversity represents an opportunity for habitat differentiation (Radford 1981)
and available niche space (Dufour et al. 2006) that is thought to support biodiversity
(Gray 2008). The continuous nature of remote sensing (RS) data enables exploration of novel measures of geodiversity. In this section we focus our discussion on
metrics of variability, although absolute values (e.g., minimum and maximum
thresholds) of some geographical features are also informative for understanding
species’ limits and ultimately species diversity. Studies have used two aspects of
variability: the absolute range of conditions and the spatial configuration of these
conditions (Spehn and Körner 2005; Dufour et al. 2006; Jackova and Romportl
2008; Serrano et al. 2009; Hjort and Luoto 2010; Hjort and Luoto 2012). The range
in conditions is an estimate of the different elements in the area of interest. Given
sampling units larger than the minimum pixel resolution, the proportional area covered by distinct geographical features could be used to calculate an evenness index
of geodiversity. Categorical features have also treated geodiversity variables similarly to species with measured presences or abundances in various geodiversity metrics (Serrano et al. 2009; Tuanmu and Jetz 2015).
Alternatively, geodiversity could be quantified as variability in continuous observations such as elevation or climate. A focus on variability allows for different geological contexts (past and present) to be taken into account. One of the most common
measures of environmental heterogeneity is elevational range (Stein et al. 2014),
simply the absolute difference between elevation at two sites or sample units
(i.e., among or within sites, respectively). Using elevation as an example, the average
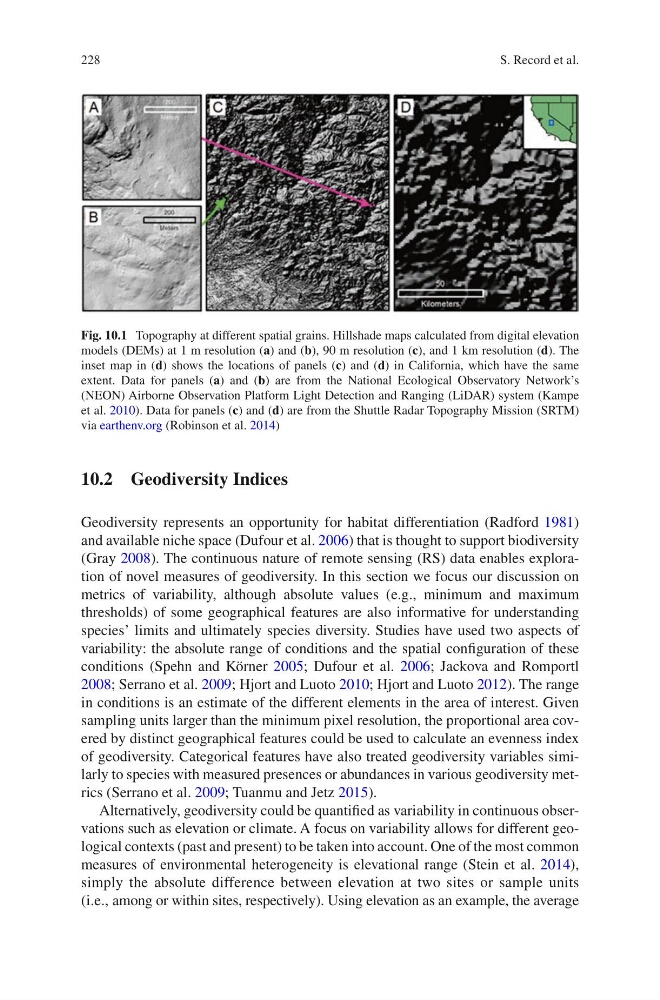
Fig. 10.1 Topography at different spatial grains. Hillshade maps calculated from digital elevation
models (DEMs) at 1 m resolution (a) and (b), 90 m resolution (c), and 1 km resolution (d). The
inset map in (d) shows the locations of panels (c) and (d) in California, which have the same
extent. Data for panels (a) and (b) are from the National Ecological Observatory Network’s
(NEON) Airborne Observation Platform Light Detection and Ranging (LiDAR) system (Kampe
et al. 2010). Data for panels (c) and (d) are from the Shuttle Radar Topography Mission (SRTM)
via earthenv.org (Robinson et al. 2014)
S. Record et al.
10.2 Geodiversity Indices
Geodiversity represents an opportunity for habitat differentiation (Radford 1981)
and available niche space (Dufour et al. 2006) that is thought to support biodiversity
(Gray 2008). The continuous nature of remote sensing (RS) data enables exploration of novel measures of geodiversity. In this section we focus our discussion on
metrics of variability, although absolute values (e.g., minimum and maximum
thresholds) of some geographical features are also informative for understanding
species’ limits and ultimately species diversity. Studies have used two aspects of
variability: the absolute range of conditions and the spatial configuration of these
conditions (Spehn and Körner 2005; Dufour et al. 2006; Jackova and Romportl
2008; Serrano et al. 2009; Hjort and Luoto 2010; Hjort and Luoto 2012). The range
in conditions is an estimate of the different elements in the area of interest. Given
sampling units larger than the minimum pixel resolution, the proportional area covered by distinct geographical features could be used to calculate an evenness index
of geodiversity. Categorical features have also treated geodiversity variables similarly to species with measured presences or abundances in various geodiversity metrics (Serrano et al. 2009; Tuanmu and Jetz 2015).
Alternatively, geodiversity could be quantified as variability in continuous observations such as elevation or climate. A focus on variability allows for different geological contexts (past and present) to be taken into account. One of the most common
measures of environmental heterogeneity is elevational range (Stein et al. 2014),
simply the absolute difference between elevation at two sites or sample units
(i.e., among or within sites, respectively). Using elevation as an example, the average
Fig. 10.1 Topography at different spatial grains. Hillshade maps calculated from digital elevation
models (DEMs) at 1 m resolution (a) and (b), 90 m resolution (c), and 1 km resolution (d). The
inset map in (d) shows the locations of panels (c) and (d) in California, which have the same
extent. Data for panels (a) and (b) are from the National Ecological Observatory Network’s
(NEON) Airborne Observation Platform Light Detection and Ranging (LiDAR) system (Kampe
et al. 2010). Data for panels (c) and (d) are from the Shuttle Radar Topography Mission (SRTM)
via earthenv.org (Robinson et al. 2014)
S. Record et al.