

3
visible wavelengths (400–700 nm), while other chemical compounds and structural
attributes of plants that tend to be conserved through evolutionary history affect
longer wavelengths. The patterns of light absorbed, transmitted, and reflected at different wavelengths from vegetation reveal leaf and canopy surface properties, tissue
chemistry, and anatomical structures and morphological attributes of leaves, whole
plants, and canopies. Thus, technological advances for assessing optical properties
of plants provide profound opportunities for detecting functional traits of organisms
at different levels of biological organization. These advances are occurring at multiple spatial scales, with technologies ranging from field spectrometers and airborne
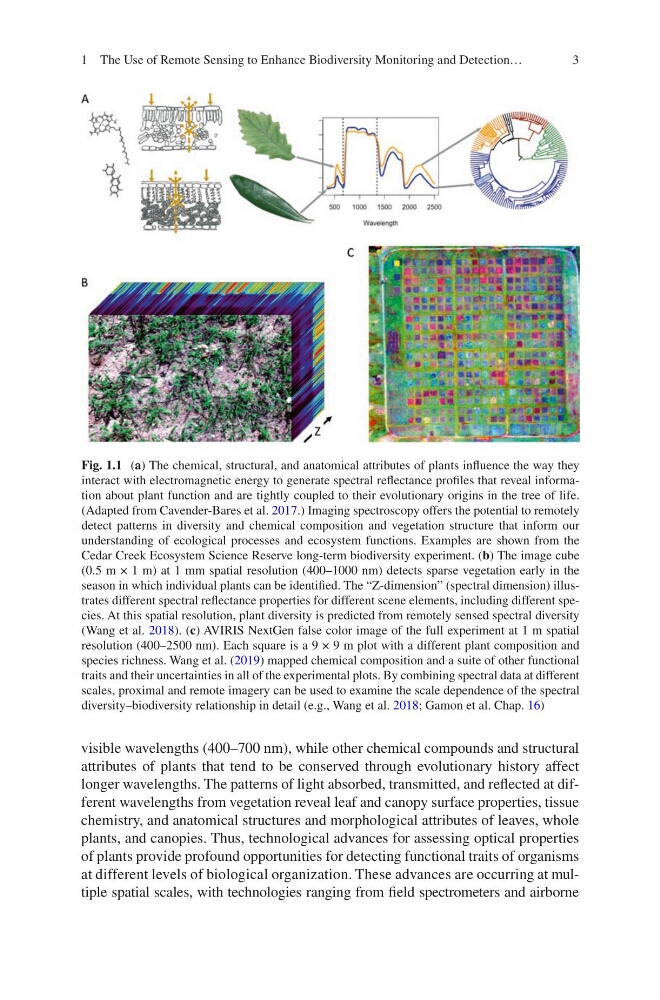
Fig. 1.1 (a) The chemical, structural, and anatomical attributes of plants influence the way they
interact with electromagnetic energy to generate spectral reflectance profiles that reveal information about plant function and are tightly coupled to their evolutionary origins in the tree of life.
(Adapted from Cavender-Bares et al. 2017.) Imaging spectroscopy offers the potential to remotely
detect patterns in diversity and chemical composition and vegetation structure that inform our
understanding of ecological processes and ecosystem functions. Examples are shown from the
Cedar Creek Ecosystem Science Reserve long-term biodiversity experiment. (b) The image cube
(0.5 m × 1 m) at 1 mm spatial resolution (400–1000 nm) detects sparse vegetation early in the
season in which individual plants can be identified. The “Z-dimension” (spectral dimension) illustrates different spectral reflectance properties for different scene elements, including different species. At this spatial resolution, plant diversity is predicted from remotely sensed spectral diversity
(Wang et al. 2018). (c) AVIRIS NextGen false color image of the full experiment at 1 m spatial
resolution (400–2500 nm). Each square is a 9 × 9 m plot with a different plant composition and
species richness. Wang et al. (2019) mapped chemical composition and a suite of other functional
traits and their uncertainties in all of the experimental plots. By combining spectral data at different
scales, proximal and remote imagery can be used to examine the scale dependence of the spectral
diversity–biodiversity relationship in detail (e.g., Wang et al. 2018; Gamon et al. Chap. 16)
1 The Use of Remote Sensing to Enhance Biodiversity Monitoring and Detection…
visible wavelengths (400–700 nm), while other chemical compounds and structural
attributes of plants that tend to be conserved through evolutionary history affect
longer wavelengths. The patterns of light absorbed, transmitted, and reflected at different wavelengths from vegetation reveal leaf and canopy surface properties, tissue
chemistry, and anatomical structures and morphological attributes of leaves, whole
plants, and canopies. Thus, technological advances for assessing optical properties
of plants provide profound opportunities for detecting functional traits of organisms
at different levels of biological organization. These advances are occurring at multiple spatial scales, with technologies ranging from field spectrometers and airborne
Fig. 1.1 (a) The chemical, structural, and anatomical attributes of plants influence the way they
interact with electromagnetic energy to generate spectral reflectance profiles that reveal information about plant function and are tightly coupled to their evolutionary origins in the tree of life.
(Adapted from Cavender-Bares et al. 2017.) Imaging spectroscopy offers the potential to remotely
detect patterns in diversity and chemical composition and vegetation structure that inform our
understanding of ecological processes and ecosystem functions. Examples are shown from the
Cedar Creek Ecosystem Science Reserve long-term biodiversity experiment. (b) The image cube
(0.5 m × 1 m) at 1 mm spatial resolution (400–1000 nm) detects sparse vegetation early in the
season in which individual plants can be identified. The “Z-dimension” (spectral dimension) illustrates different spectral reflectance properties for different scene elements, including different species. At this spatial resolution, plant diversity is predicted from remotely sensed spectral diversity
(Wang et al. 2018). (c) AVIRIS NextGen false color image of the full experiment at 1 m spatial
resolution (400–2500 nm). Each square is a 9 × 9 m plot with a different plant composition and
species richness. Wang et al. (2019) mapped chemical composition and a suite of other functional
traits and their uncertainties in all of the experimental plots. By combining spectral data at different
scales, proximal and remote imagery can be used to examine the scale dependence of the spectral
diversity–biodiversity relationship in detail (e.g., Wang et al. 2018; Gamon et al. Chap. 16)
1 The Use of Remote Sensing to Enhance Biodiversity Monitoring and Detection…