

203
been made freely available (Turner et al. 2003; Hobi et al. 2017) with the potential
to track the spatial variation in the chemical composition of vegetation (Wang et al.
2019; Serbin and Townsend, Chap. 3), physiology, structure, and function (Lausch
et al., Chap. 13; Serbin and Townsend, Chap. 3; Myneni et al. 2002; Saatchi et al.
2008; Jetz et al. 2016).
Despite the potential of S-RS products for measuring and modeling biodiversity
(Gillespie et al. 2008; Pettorelli et al. 2014a, b; Turner 2014; Cord et al. 2013;
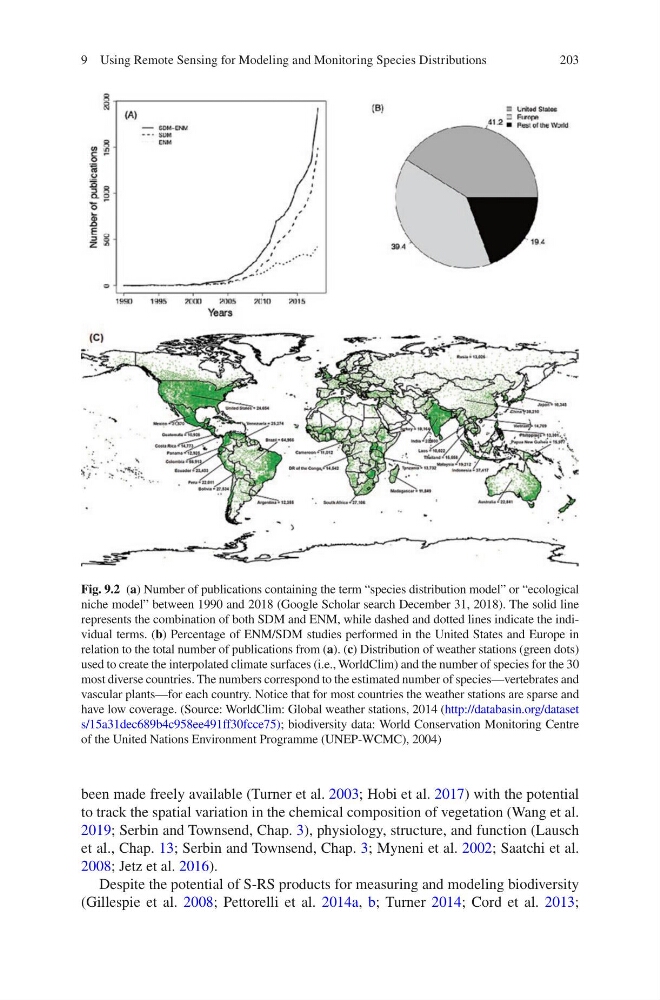
Fig. 9.2 (a) Number of publications containing the term “species distribution model” or “ecological
niche model” between 1990 and 2018 (Google Scholar search December 31, 2018). The solid line
represents the combination of both SDM and ENM, while dashed and dotted lines indicate the individual terms. (b) Percentage of ENM/SDM studies performed in the United States and Europe in
relation to the total number of publications from (a). (c) Distribution of weather stations (green dots)
used to create the interpolated climate surfaces (i.e., WorldClim) and the number of species for the 30
most diverse countries. The numbers correspond to the estimated number of species—vertebrates and
vascular plants—for each country. Notice that for most countries the weather stations are sparse and
have low coverage. (Source: WorldClim: Global weather stations, 2014 (http://databasin.org/dataset
s/15a31dec689b4c958ee491ff30fcce75); biodiversity data: World Conservation Monitoring Centre
of the United Nations Environment Programme (UNEP-WCMC), 2004)
9 Using Remote Sensing for Modeling and Monitoring Species Distributions
been made freely available (Turner et al. 2003; Hobi et al. 2017) with the potential
to track the spatial variation in the chemical composition of vegetation (Wang et al.
2019; Serbin and Townsend, Chap. 3), physiology, structure, and function (Lausch
et al., Chap. 13; Serbin and Townsend, Chap. 3; Myneni et al. 2002; Saatchi et al.
2008; Jetz et al. 2016).
Despite the potential of S-RS products for measuring and modeling biodiversity
(Gillespie et al. 2008; Pettorelli et al. 2014a, b; Turner 2014; Cord et al. 2013;
Fig. 9.2 (a) Number of publications containing the term “species distribution model” or “ecological
niche model” between 1990 and 2018 (Google Scholar search December 31, 2018). The solid line
represents the combination of both SDM and ENM, while dashed and dotted lines indicate the individual terms. (b) Percentage of ENM/SDM studies performed in the United States and Europe in
relation to the total number of publications from (a). (c) Distribution of weather stations (green dots)
used to create the interpolated climate surfaces (i.e., WorldClim) and the number of species for the 30
most diverse countries. The numbers correspond to the estimated number of species—vertebrates and
vascular plants—for each country. Notice that for most countries the weather stations are sparse and
have low coverage. (Source: WorldClim: Global weather stations, 2014 (http://databasin.org/dataset
s/15a31dec689b4c958ee491ff30fcce75); biodiversity data: World Conservation Monitoring Centre
of the United Nations Environment Programme (UNEP-WCMC), 2004)
9 Using Remote Sensing for Modeling and Monitoring Species Distributions