

201
9.2 Theoretical Background
9.2.1 The BAM Diagram
One way to explore the ubiquitous relationship between the spatial and temporal
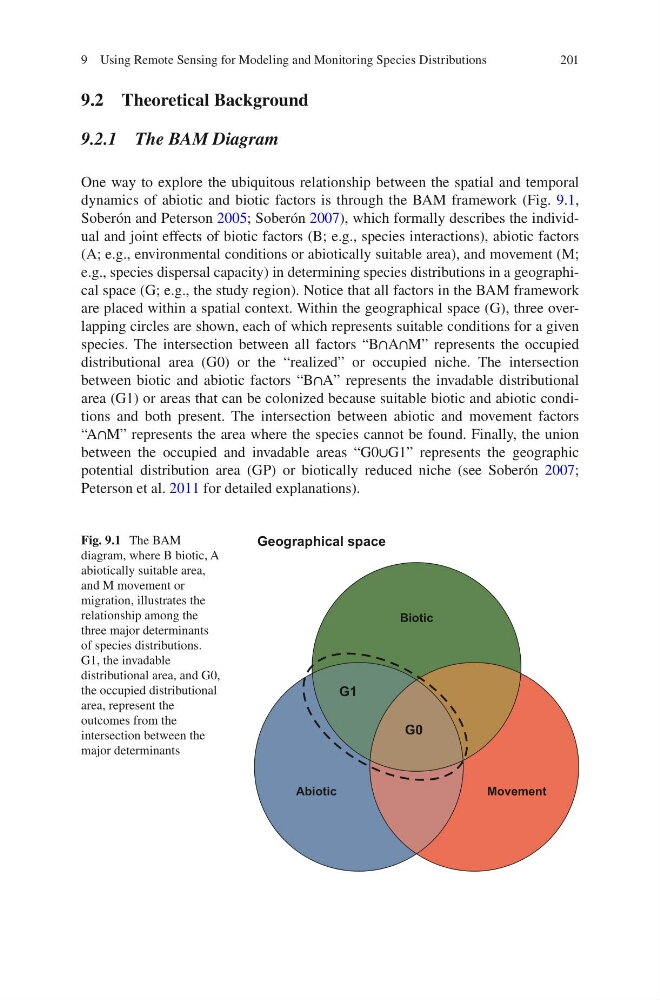
dynamics of abiotic and biotic factors is through the BAM framework (Fig. 9.1,
Soberón and Peterson 2005; Soberón 2007), which formally describes the individual and joint effects of biotic factors (B; e.g., species interactions), abiotic factors
(A; e.g., environmental conditions or abiotically suitable area), and movement (M;
e.g., species dispersal capacity) in determining species distributions in a geographical space (G; e.g., the study region). Notice that all factors in the BAM framework
are placed within a spatial context. Within the geographical space (G), three overlapping circles are shown, each of which represents suitable conditions for a given
species. The intersection between all factors “B∩A∩M” represents the occupied
distributional area (G0) or the “realized” or occupied niche. The intersection
between biotic and abiotic factors “B∩A” represents the invadable distributional
area (G1) or areas that can be colonized because suitable biotic and abiotic conditions and both present. The intersection between abiotic and movement factors
“A∩M” represents the area where the species cannot be found. Finally, the union
between the occupied and invadable areas “G0∪G1” represents the geographic
potential distribution area (GP) or biotically reduced niche (see Soberón 2007;
Peterson et al. 2011 for detailed explanations).
Abiotic
Movement
Biotic
Geographical space
G0
G1
Fig. 9.1 The BAM
diagram, where B biotic, A
abiotically suitable area,
and M movement or
migration, illustrates the
relationship among the
three major determinants
of species distributions.
G1, the invadable
distributional area, and G0,
the occupied distributional
area, represent the
outcomes from the
intersection between the
major determinants
9 Using Remote Sensing for Modeling and Monitoring Species Distributions
9.2 Theoretical Background
9.2.1 The BAM Diagram
One way to explore the ubiquitous relationship between the spatial and temporal
dynamics of abiotic and biotic factors is through the BAM framework (Fig. 9.1,
Soberón and Peterson 2005; Soberón 2007), which formally describes the individual and joint effects of biotic factors (B; e.g., species interactions), abiotic factors
(A; e.g., environmental conditions or abiotically suitable area), and movement (M;
e.g., species dispersal capacity) in determining species distributions in a geographical space (G; e.g., the study region). Notice that all factors in the BAM framework
are placed within a spatial context. Within the geographical space (G), three overlapping circles are shown, each of which represents suitable conditions for a given
species. The intersection between all factors “B∩A∩M” represents the occupied
distributional area (G0) or the “realized” or occupied niche. The intersection
between biotic and abiotic factors “B∩A” represents the invadable distributional
area (G1) or areas that can be colonized because suitable biotic and abiotic conditions and both present. The intersection between abiotic and movement factors
“A∩M” represents the area where the species cannot be found. Finally, the union
between the occupied and invadable areas “G0∪G1” represents the geographic
potential distribution area (GP) or biotically reduced niche (see Soberón 2007;
Peterson et al. 2011 for detailed explanations).
Abiotic
Movement
Biotic
Geographical space
G0
G1
Fig. 9.1 The BAM
diagram, where B biotic, A
abiotically suitable area,
and M movement or
migration, illustrates the
relationship among the
three major determinants
of species distributions.
G1, the invadable
distributional area, and G0,
the occupied distributional
area, represent the
outcomes from the
intersection between the
major determinants
9 Using Remote Sensing for Modeling and Monitoring Species Distributions