

159
many random changes in trait values (due to varied processes), it may be described
by a normal distribution. This model of evolution is known as Brownian motion
(Felsenstein 1985). The pace at which those changes accumulate is at the core of
what we call the rate of evolution, and it is captured by the variance of the normal
distribution (whose mean is the trait value at the root).
When lineages split, they start out with the same trait value and then diverge
independently. It is easy then to see that the expected amount of trait variation
between lineages depends on both the rate of evolution and on the divergence time.
This leads to the expectation that trait values should be on average more similar
among closely related taxa—which had little time to diverge—than among distantly
related taxa. Such expectation is at the core of the concept of phylogenetic signal
(see Sect. 7.3.2) and the idea that phylogenetic relatedness can be used as a proxy
for functional similarity (Webb et al. 2002), particularly when integrating across a
large number of traits (Cavender-Bares et al. 2009).
7.3.1.2 Ornstein–Uhlenbeck
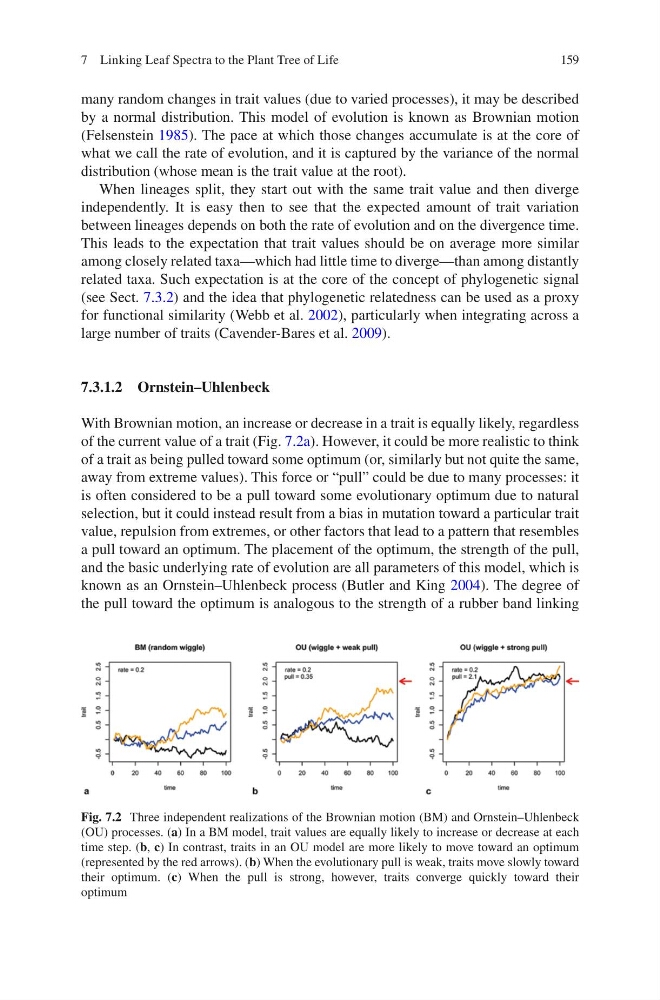
With Brownian motion, an increase or decrease in a trait is equally likely, regardless
of the current value of a trait (Fig. 7.2a). However, it could be more realistic to think
of a trait as being pulled toward some optimum (or, similarly but not quite the same,
away from extreme values). This force or “pull” could be due to many processes: it
is often considered to be a pull toward some evolutionary optimum due to natural
selection, but it could instead result from a bias in mutation toward a particular trait
value, repulsion from extremes, or other factors that lead to a pattern that resembles
a pull toward an optimum. The placement of the optimum, the strength of the pull,
and the basic underlying rate of evolution are all parameters of this model, which is
known as an Ornstein–Uhlenbeck process (Butler and King 2004). The degree of
the pull toward the optimum is analogous to the strength of a rubber band linking
Fig. 7.2 Three independent realizations of the Brownian motion (BM) and Ornstein–Uhlenbeck
(OU) processes. (a) In a BM model, trait values are equally likely to increase or decrease at each
time step. (b, c) In contrast, traits in an OU model are more likely to move toward an optimum
(represented by the red arrows). (b) When the evolutionary pull is weak, traits move slowly toward
their optimum. (c) When the pull is strong, however, traits converge quickly toward their
optimum
7 Linking Leaf Spectra to the Plant Tree of Life
many random changes in trait values (due to varied processes), it may be described
by a normal distribution. This model of evolution is known as Brownian motion
(Felsenstein 1985). The pace at which those changes accumulate is at the core of
what we call the rate of evolution, and it is captured by the variance of the normal
distribution (whose mean is the trait value at the root).
When lineages split, they start out with the same trait value and then diverge
independently. It is easy then to see that the expected amount of trait variation
between lineages depends on both the rate of evolution and on the divergence time.
This leads to the expectation that trait values should be on average more similar
among closely related taxa—which had little time to diverge—than among distantly
related taxa. Such expectation is at the core of the concept of phylogenetic signal
(see Sect. 7.3.2) and the idea that phylogenetic relatedness can be used as a proxy
for functional similarity (Webb et al. 2002), particularly when integrating across a
large number of traits (Cavender-Bares et al. 2009).
7.3.1.2 Ornstein–Uhlenbeck
With Brownian motion, an increase or decrease in a trait is equally likely, regardless
of the current value of a trait (Fig. 7.2a). However, it could be more realistic to think
of a trait as being pulled toward some optimum (or, similarly but not quite the same,
away from extreme values). This force or “pull” could be due to many processes: it
is often considered to be a pull toward some evolutionary optimum due to natural
selection, but it could instead result from a bias in mutation toward a particular trait
value, repulsion from extremes, or other factors that lead to a pattern that resembles
a pull toward an optimum. The placement of the optimum, the strength of the pull,
and the basic underlying rate of evolution are all parameters of this model, which is
known as an Ornstein–Uhlenbeck process (Butler and King 2004). The degree of
the pull toward the optimum is analogous to the strength of a rubber band linking
Fig. 7.2 Three independent realizations of the Brownian motion (BM) and Ornstein–Uhlenbeck
(OU) processes. (a) In a BM model, trait values are equally likely to increase or decrease at each
time step. (b, c) In contrast, traits in an OU model are more likely to move toward an optimum
(represented by the red arrows). (b) When the evolutionary pull is weak, traits move slowly toward
their optimum. (c) When the pull is strong, however, traits converge quickly toward their
optimum
7 Linking Leaf Spectra to the Plant Tree of Life