

157
among species and lineages is also critical for making meaningful inferences about
evolution. As we will discuss in the next section, estimates of the pace of trait evolution depends on the amount of change in a trait that occurs over a unit of time.
There are today several resources to help generate a good phylogenetic tree for a
set of species. A common approach is to trim the whole plant tree of life—taken
from the Open Tree of Life (Hinchliff et al. 2015) or Phylomatic (Webb and
Donoghue 2005), for example—to the set of species of interest. A second option is
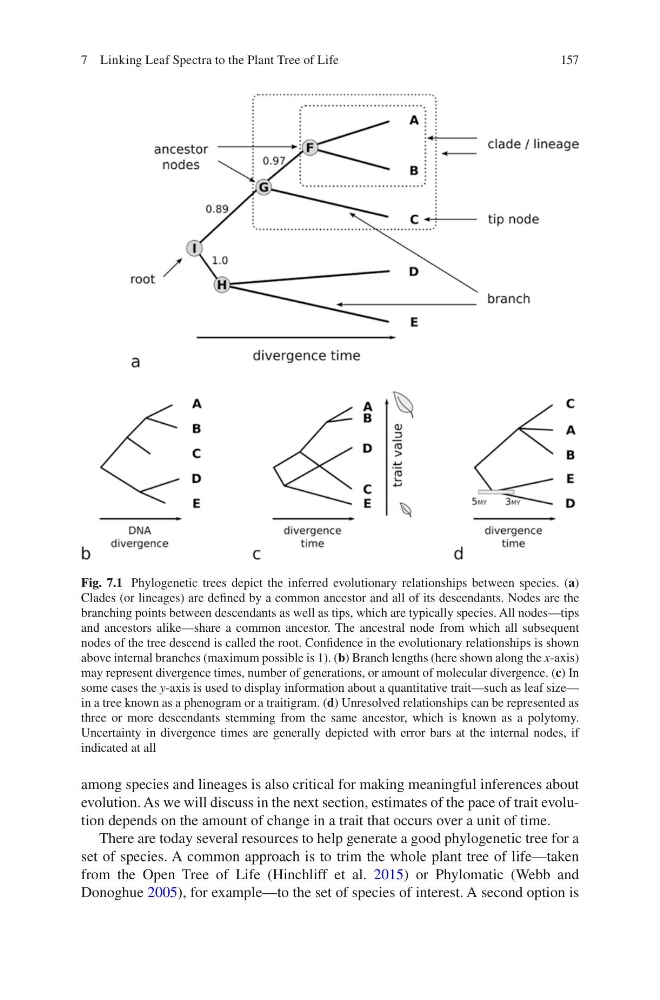
Fig. 7.1 Phylogenetic trees depict the inferred evolutionary relationships between species. (a)
Clades (or lineages) are defined by a common ancestor and all of its descendants. Nodes are the
branching points between descendants as well as tips, which are typically species. All nodes—tips
and ancestors alike—share a common ancestor. The ancestral node from which all subsequent
nodes of the tree descend is called the root. Confidence in the evolutionary relationships is shown
above internal branches (maximum possible is 1). (b) Branch lengths (here shown along the x-axis)
may represent divergence times, number of generations, or amount of molecular divergence. (c) In
some cases the y-axis is used to display information about a quantitative trait—such as leaf size—
in a tree known as a phenogram or a traitigram. (d) Unresolved relationships can be represented as
three or more descendants stemming from the same ancestor, which is known as a polytomy.
Uncertainty in divergence times are generally depicted with error bars at the internal nodes, if
indicated at all
7 Linking Leaf Spectra to the Plant Tree of Life
among species and lineages is also critical for making meaningful inferences about
evolution. As we will discuss in the next section, estimates of the pace of trait evolution depends on the amount of change in a trait that occurs over a unit of time.
There are today several resources to help generate a good phylogenetic tree for a
set of species. A common approach is to trim the whole plant tree of life—taken
from the Open Tree of Life (Hinchliff et al. 2015) or Phylomatic (Webb and
Donoghue 2005), for example—to the set of species of interest. A second option is
Fig. 7.1 Phylogenetic trees depict the inferred evolutionary relationships between species. (a)
Clades (or lineages) are defined by a common ancestor and all of its descendants. Nodes are the
branching points between descendants as well as tips, which are typically species. All nodes—tips
and ancestors alike—share a common ancestor. The ancestral node from which all subsequent
nodes of the tree descend is called the root. Confidence in the evolutionary relationships is shown
above internal branches (maximum possible is 1). (b) Branch lengths (here shown along the x-axis)
may represent divergence times, number of generations, or amount of molecular divergence. (c) In
some cases the y-axis is used to display information about a quantitative trait—such as leaf size—
in a tree known as a phenogram or a traitigram. (d) Unresolved relationships can be represented as
three or more descendants stemming from the same ancestor, which is known as a polytomy.
Uncertainty in divergence times are generally depicted with error bars at the internal nodes, if
indicated at all
7 Linking Leaf Spectra to the Plant Tree of Life