

136
may be used to help account for differences in reflectance due to illumination or
topography. Many vegetation indices have been designed for use with specific
broadband sensors to assess general canopy characteristics such as relative “greenness,” canopy density, or canopy condition (Table 6.1). But because of contributions
in the field of spectroscopy, there is a wealth of literature that highlights specific
regions of the electromagnetic spectrum (EMS) that are specifically associated with
foliar chemistry, chlorophyll or carotenoid content, various metrics of photosynthetic activity, and other common stress markers (see Serbin et al. 2014, 2015; Singh
et al. 2015).
Some of the vegetation indices listed in Table 6.1 are easily captured with widely
available sensors. Others require reflectance information from narrow spectral regions
that may only be accurately measured with hyperspectral sensors. Others may be
located in regions that are outside of the EMS range of the imagery that is available.
Thus, the number of available indices will depend on the imagery you have. Which
index will prove most useful in detecting early canopy stress depends on the specific
stress symptoms and the conditions of your study area. For example, in ecosystems
with relatively sparse vegetation, a soil-adjusted vegetation index may work best to
minimize the impact of background reflectance. Similarly, in ecosystems with very
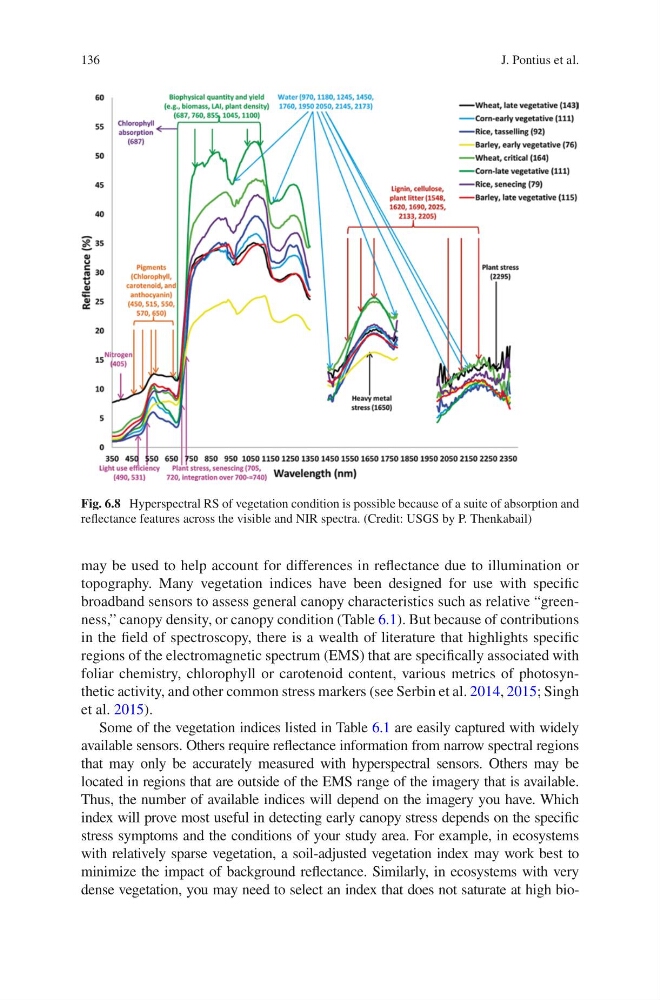
dense vegetation, you may need to select an index that does not saturate at high bioFig. 6.8 Hyperspectral RS of vegetation condition is possible because of a suite of absorption and
reflectance features across the visible and NIR spectra. (Credit: USGS by P. Thenkabail)
J. Pontius et al.
may be used to help account for differences in reflectance due to illumination or
topography. Many vegetation indices have been designed for use with specific
broadband sensors to assess general canopy characteristics such as relative “greenness,” canopy density, or canopy condition (Table 6.1). But because of contributions
in the field of spectroscopy, there is a wealth of literature that highlights specific
regions of the electromagnetic spectrum (EMS) that are specifically associated with
foliar chemistry, chlorophyll or carotenoid content, various metrics of photosynthetic activity, and other common stress markers (see Serbin et al. 2014, 2015; Singh
et al. 2015).
Some of the vegetation indices listed in Table 6.1 are easily captured with widely
available sensors. Others require reflectance information from narrow spectral regions
that may only be accurately measured with hyperspectral sensors. Others may be
located in regions that are outside of the EMS range of the imagery that is available.
Thus, the number of available indices will depend on the imagery you have. Which
index will prove most useful in detecting early canopy stress depends on the specific
stress symptoms and the conditions of your study area. For example, in ecosystems
with relatively sparse vegetation, a soil-adjusted vegetation index may work best to
minimize the impact of background reflectance. Similarly, in ecosystems with very
dense vegetation, you may need to select an index that does not saturate at high bioFig. 6.8 Hyperspectral RS of vegetation condition is possible because of a suite of absorption and
reflectance features across the visible and NIR spectra. (Credit: USGS by P. Thenkabail)
J. Pontius et al.