

114
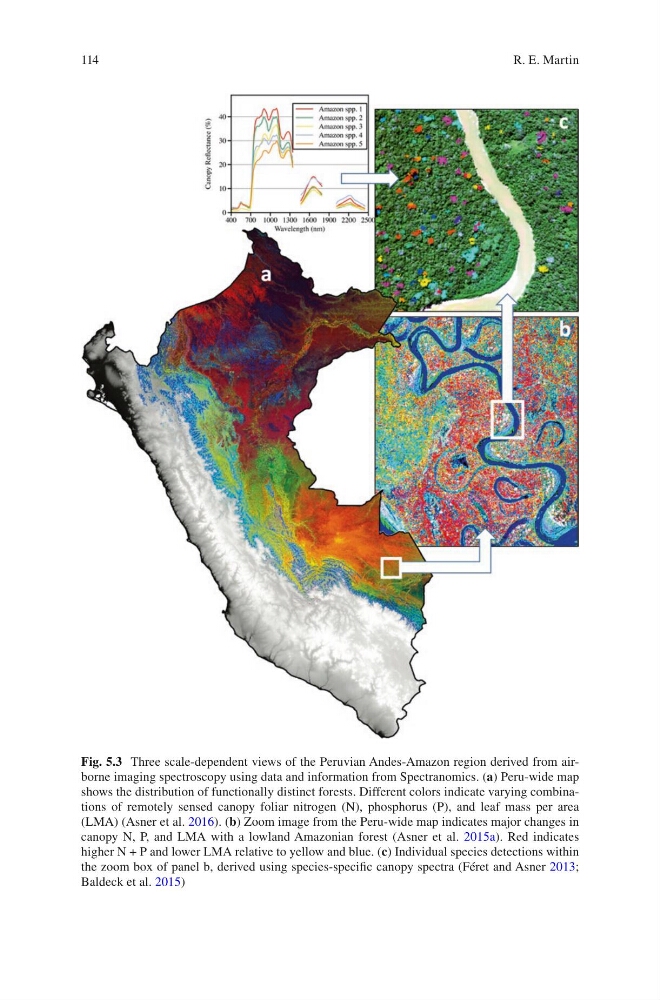
Fig. 5.3 Three scale-dependent views of the Peruvian Andes-Amazon region derived from airborne imaging spectroscopy using data and information from Spectranomics. (a) Peru-wide map
shows the distribution of functionally distinct forests. Different colors indicate varying combinations of remotely sensed canopy foliar nitrogen (N), phosphorus (P), and leaf mass per area
(LMA) (Asner et al. 2016). (b) Zoom image from the Peru-wide map indicates major changes in
canopy N, P, and LMA with a lowland Amazonian forest (Asner et al. 2015a). Red indicates
higher N + P and lower LMA relative to yellow and blue. (c) Individual species detections within
the zoom box of panel b, derived using species-specific canopy spectra (Féret and Asner 2013;
Baldeck et al. 2015)
R. E. Martin
Fig. 5.3 Three scale-dependent views of the Peruvian Andes-Amazon region derived from airborne imaging spectroscopy using data and information from Spectranomics. (a) Peru-wide map
shows the distribution of functionally distinct forests. Different colors indicate varying combinations of remotely sensed canopy foliar nitrogen (N), phosphorus (P), and leaf mass per area
(LMA) (Asner et al. 2016). (b) Zoom image from the Peru-wide map indicates major changes in
canopy N, P, and LMA with a lowland Amazonian forest (Asner et al. 2015a). Red indicates
higher N + P and lower LMA relative to yellow and blue. (c) Individual species detections within
the zoom box of panel b, derived using species-specific canopy spectra (Féret and Asner 2013;
Baldeck et al. 2015)
R. E. Martin