

110
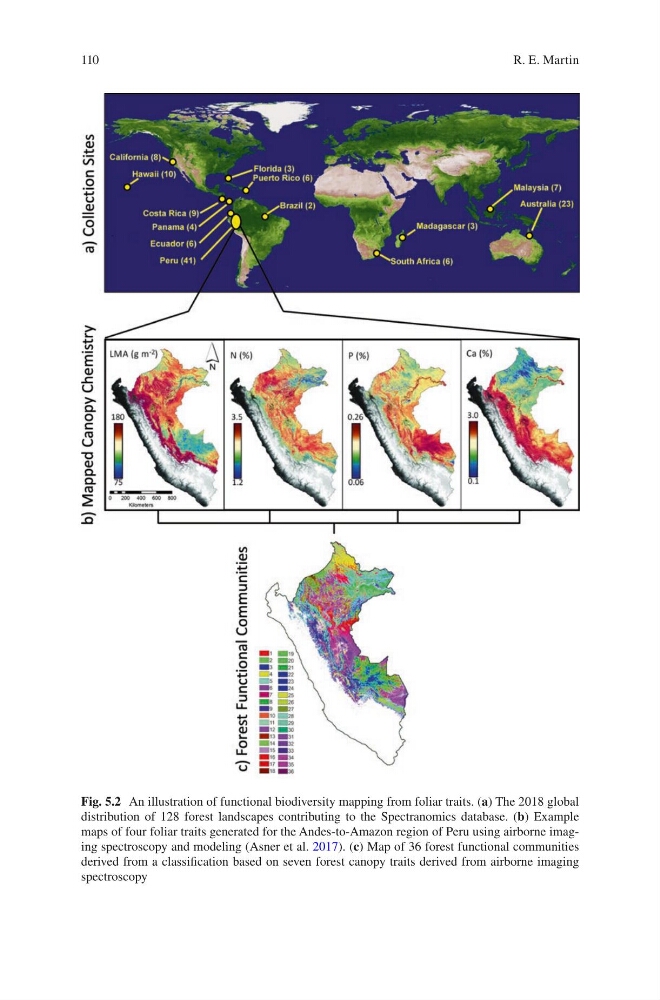
Fig. 5.2 An illustration of functional biodiversity mapping from foliar traits. (a) The 2018 global
distribution of 128 forest landscapes contributing to the Spectranomics database. (b) Example
maps of four foliar traits generated for the Andes-to-Amazon region of Peru using airborne imaging spectroscopy and modeling (Asner et al. 2017). (c) Map of 36 forest functional communities
derived from a classification based on seven forest canopy traits derived from airborne imaging
spectroscopy
R. E. Martin
Fig. 5.2 An illustration of functional biodiversity mapping from foliar traits. (a) The 2018 global
distribution of 128 forest landscapes contributing to the Spectranomics database. (b) Example
maps of four foliar traits generated for the Andes-to-Amazon region of Peru using airborne imaging spectroscopy and modeling (Asner et al. 2017). (c) Map of 36 forest functional communities
derived from a classification based on seven forest canopy traits derived from airborne imaging
spectroscopy
R. E. Martin