

86
regime of the forest, (ii) tested the simulation by comparing simulated and actual RS
data in their spectral and spatial information dimension, and (iii) use the approach to
demonstrate how remotely sensed functional traits can be used to compute regionalscale functional richness, showcasing the information content of RS-EBVs.
4.2 The Laegeren Site: Description and History
The Laegeren site is located at N 47° 28′, 49″ and E 8° 21′, 05″ at 680 m a.s.l. on the
southern slope of the Laegeren mountain, approximately 15 km northwest of Zürich,
Switzerland (Fig. 4.2). The southern slope of the Laegeren marks the boundary of the
Swiss Plateau, which is bordered by the Jura and the Alps. Since 1986, a 45-m-tall
flux tower has provided micrometeorological data at high temporal resolution. Since
April 2004, CO 2 and H 2 O flux measurements are a routinely contribution to the
FLUXNET/CarboEurope-IP network (Eugster et al. 2007). The mean annual temperature is 8°C. The mean annual precipitation is 1200 mm, and the growing season
lasts 170–190 days. The natural vegetation cover around the tower is a mixed
beech forest. The western part is dominated by broad-leaved trees, mainly beech
(Fagus sylvatica L.) and ash (Fraxinus excelsior L.). In the eastern part, beech and
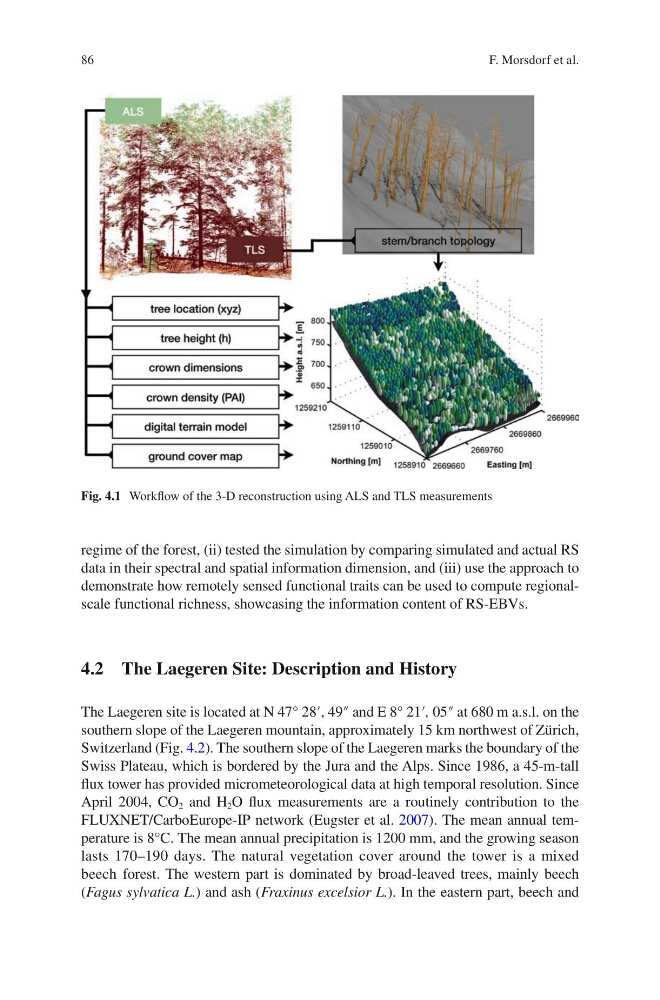
Fig. 4.1 Workflow of the 3-D reconstruction using ALS and TLS measurements
F. Morsdorf et al.
regime of the forest, (ii) tested the simulation by comparing simulated and actual RS
data in their spectral and spatial information dimension, and (iii) use the approach to
demonstrate how remotely sensed functional traits can be used to compute regionalscale functional richness, showcasing the information content of RS-EBVs.
4.2 The Laegeren Site: Description and History
The Laegeren site is located at N 47° 28′, 49″ and E 8° 21′, 05″ at 680 m a.s.l. on the
southern slope of the Laegeren mountain, approximately 15 km northwest of Zürich,
Switzerland (Fig. 4.2). The southern slope of the Laegeren marks the boundary of the
Swiss Plateau, which is bordered by the Jura and the Alps. Since 1986, a 45-m-tall
flux tower has provided micrometeorological data at high temporal resolution. Since
April 2004, CO 2 and H 2 O flux measurements are a routinely contribution to the
FLUXNET/CarboEurope-IP network (Eugster et al. 2007). The mean annual temperature is 8°C. The mean annual precipitation is 1200 mm, and the growing season
lasts 170–190 days. The natural vegetation cover around the tower is a mixed
beech forest. The western part is dominated by broad-leaved trees, mainly beech
(Fagus sylvatica L.) and ash (Fraxinus excelsior L.). In the eastern part, beech and
Fig. 4.1 Workflow of the 3-D reconstruction using ALS and TLS measurements
F. Morsdorf et al.