

amorphous, while highly crystalline fractions are expected at higher temperatures
(around 120
C). The fractions obtained between these two extreme temperatures
are assumed to be semi-crystalline with compositional differences. All fractions
were analysed by DSC,
13 C-NMR and SEC-FTIR for determination of their chemical composition and thermal properties.
The relationships established by Ray et al. [63] and Randall [64] were used to
calculate the comonomer contents and monomer sequence distributions from NMR;
see Table 2.1. The method described by Kanezaki et al. [65] was used to obtain the
isotacticity (% mmmm) data for the PP part; see Table 2.2.
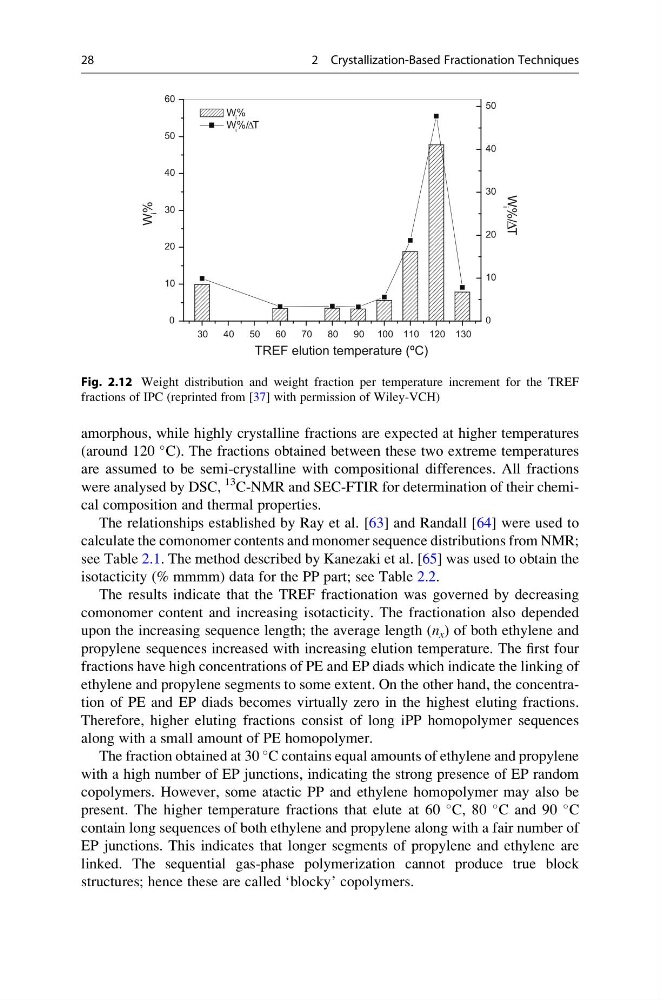
The results indicate that the TREF fractionation was governed by decreasing
comonomer content and increasing isotacticity. The fractionation also depended
upon the increasing sequence length; the average length (n x ) of both ethylene and
propylene sequences increased with increasing elution temperature. The first four
fractions have high concentrations of PE and EP diads which indicate the linking of
ethylene and propylene segments to some extent. On the other hand, the concentration of PE and EP diads becomes virtually zero in the highest eluting fractions.
Therefore, higher eluting fractions consist of long iPP homopolymer sequences
along with a small amount of PE homopolymer.
The fraction obtained at 30
C contains equal amounts of ethylene and propylene
with a high number of EP junctions, indicating the strong presence of EP random
copolymers. However, some atactic PP and ethylene homopolymer may also be
present. The higher temperature fractions that elute at 60
C, 80
C and 90
C
contain long sequences of both ethylene and propylene along with a fair number of
EP junctions. This indicates that longer segments of propylene and ethylene are
linked. The sequential gas-phase polymerization cannot produce true block
structures; hence these are called ‘blocky’ copolymers.
30
40
50
60
70
80
90 100 110 120 130
0
10
20
30
40
50
60
W i %/DT
W i %
W i %/DT
W
i
%
TREF elution temperature (ºC)
0
10
20
30
40
50
Fig. 2.12 Weight distribution and weight fraction per temperature increment for the TREF
fractions of IPC (reprinted from [37] with permission of Wiley-VCH)
28
2 Crystallization-Based Fractionation Techniques
(around 120
C). The fractions obtained between these two extreme temperatures
are assumed to be semi-crystalline with compositional differences. All fractions
were analysed by DSC,
13 C-NMR and SEC-FTIR for determination of their chemical composition and thermal properties.
The relationships established by Ray et al. [63] and Randall [64] were used to
calculate the comonomer contents and monomer sequence distributions from NMR;
see Table 2.1. The method described by Kanezaki et al. [65] was used to obtain the
isotacticity (% mmmm) data for the PP part; see Table 2.2.
The results indicate that the TREF fractionation was governed by decreasing
comonomer content and increasing isotacticity. The fractionation also depended
upon the increasing sequence length; the average length (n x ) of both ethylene and
propylene sequences increased with increasing elution temperature. The first four
fractions have high concentrations of PE and EP diads which indicate the linking of
ethylene and propylene segments to some extent. On the other hand, the concentration of PE and EP diads becomes virtually zero in the highest eluting fractions.
Therefore, higher eluting fractions consist of long iPP homopolymer sequences
along with a small amount of PE homopolymer.
The fraction obtained at 30
C contains equal amounts of ethylene and propylene
with a high number of EP junctions, indicating the strong presence of EP random
copolymers. However, some atactic PP and ethylene homopolymer may also be
present. The higher temperature fractions that elute at 60
C, 80
C and 90
C
contain long sequences of both ethylene and propylene along with a fair number of
EP junctions. This indicates that longer segments of propylene and ethylene are
linked. The sequential gas-phase polymerization cannot produce true block
structures; hence these are called ‘blocky’ copolymers.
30
40
50
60
70
80
90 100 110 120 130
0
10
20
30
40
50
60
W i %/DT
W i %
W i %/DT
W
i
%
TREF elution temperature (ºC)
0
10
20
30
40
50
Fig. 2.12 Weight distribution and weight fraction per temperature increment for the TREF
fractions of IPC (reprinted from [37] with permission of Wiley-VCH)
28
2 Crystallization-Based Fractionation Techniques