

% comonomer to give a suitable calibration curve. Quite frequently, copolymer
composition is expressed as the number of methyl groups per 1,000 carbons (CH 3 /
1,000C).
A much more feasible approach is the ‘real time’ measurement of the copolymer
composition using an online FTIR detector. In this case, the analysis relies on the
measurement of the absorption bands of the backbone methylene groups
(at 2,855 cm
À1 and 2,926 cm
À1 ) corresponding to the total concentration and the
methyl groups (at 2,874 cm
À1 and 2,957 cm
À1 ) corresponding to the concentration
of the comonomer [48, 49]. As the intensities of the IR absorption bands do not
directly correspond to concentration, a calibration of the FTIR data must be
conducted. In the present case, blends of a linear PE and a low molar mass
hydrocarbon (e.g. eicosane) as well as well defined single-site catalyst resins
were used. It is known that for high molar mass linear PE the methyl chain ends
contribute little to the visible complexity of the spectrum. Thus, the linear PE
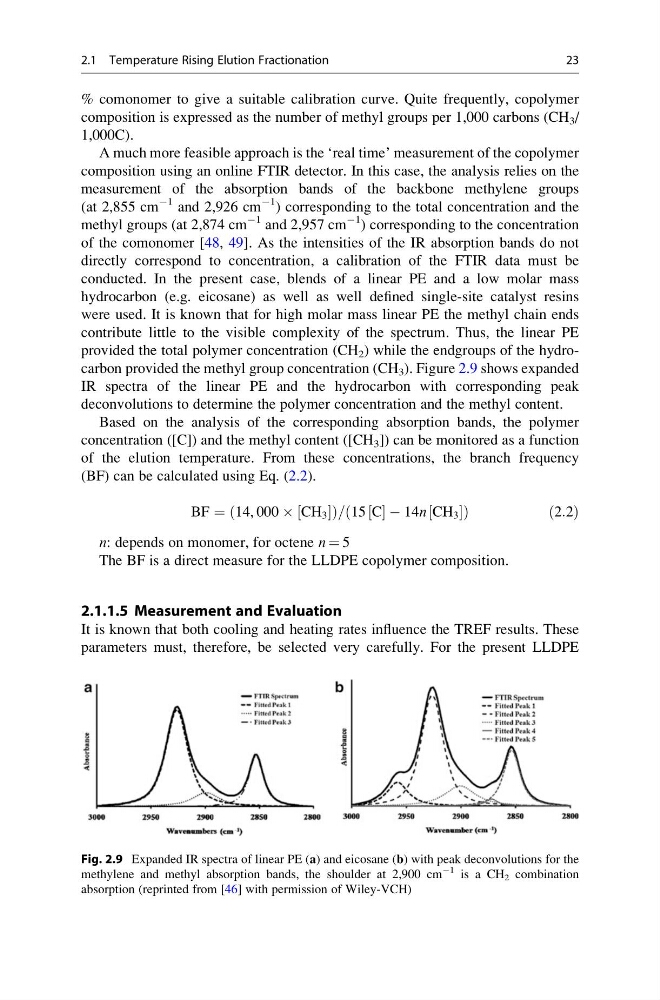
provided the total polymer concentration (CH 2 ) while the endgroups of the hydrocarbon provided the methyl group concentration (CH 3 ). Figure 2.9 shows expanded
IR spectra of the linear PE and the hydrocarbon with corresponding peak
deconvolutions to determine the polymer concentration and the methyl content.
Based on the analysis of the corresponding absorption bands, the polymer
concentration ([C]) and the methyl content ([CH 3 ]) can be monitored as a function
of the elution temperature. From these concentrations, the branch frequency
(BF) can be calculated using Eq. (2.2).
BF ¼ 14, 000 Â CH 3
½
ð
Þ = 15 C
½ À 14n CH 3
½
ð
Þ
ð 2:2Þ
n: depends on monomer, for octene n ¼ 5
The BF is a direct measure for the LLDPE copolymer composition.
2.1.1.5 Measurement and Evaluation
It is known that both cooling and heating rates influence the TREF results. These
parameters must, therefore, be selected very carefully. For the present LLDPE
Fig. 2.9 Expanded IR spectra of linear PE (a) and eicosane (b) with peak deconvolutions for the
methylene and methyl absorption bands, the shoulder at 2,900 cm
À1 is a CH 2 combination
absorption (reprinted from [46] with permission of Wiley-VCH)
2.1 Temperature Rising Elution Fractionation
23
composition is expressed as the number of methyl groups per 1,000 carbons (CH 3 /
1,000C).
A much more feasible approach is the ‘real time’ measurement of the copolymer
composition using an online FTIR detector. In this case, the analysis relies on the
measurement of the absorption bands of the backbone methylene groups
(at 2,855 cm
À1 and 2,926 cm
À1 ) corresponding to the total concentration and the
methyl groups (at 2,874 cm
À1 and 2,957 cm
À1 ) corresponding to the concentration
of the comonomer [48, 49]. As the intensities of the IR absorption bands do not
directly correspond to concentration, a calibration of the FTIR data must be
conducted. In the present case, blends of a linear PE and a low molar mass
hydrocarbon (e.g. eicosane) as well as well defined single-site catalyst resins
were used. It is known that for high molar mass linear PE the methyl chain ends
contribute little to the visible complexity of the spectrum. Thus, the linear PE
provided the total polymer concentration (CH 2 ) while the endgroups of the hydrocarbon provided the methyl group concentration (CH 3 ). Figure 2.9 shows expanded
IR spectra of the linear PE and the hydrocarbon with corresponding peak
deconvolutions to determine the polymer concentration and the methyl content.
Based on the analysis of the corresponding absorption bands, the polymer
concentration ([C]) and the methyl content ([CH 3 ]) can be monitored as a function
of the elution temperature. From these concentrations, the branch frequency
(BF) can be calculated using Eq. (2.2).
BF ¼ 14, 000 Â CH 3
½
ð
Þ = 15 C
½ À 14n CH 3
½
ð
Þ
ð 2:2Þ
n: depends on monomer, for octene n ¼ 5
The BF is a direct measure for the LLDPE copolymer composition.
2.1.1.5 Measurement and Evaluation
It is known that both cooling and heating rates influence the TREF results. These
parameters must, therefore, be selected very carefully. For the present LLDPE
Fig. 2.9 Expanded IR spectra of linear PE (a) and eicosane (b) with peak deconvolutions for the
methylene and methyl absorption bands, the shoulder at 2,900 cm
À1 is a CH 2 combination
absorption (reprinted from [46] with permission of Wiley-VCH)
2.1 Temperature Rising Elution Fractionation
23